
Table of Contents
Objectives
Mission
- Recall the mission of the National/Naval Ice Center (NIC).
- List and describe the routine products available from the NIC.
- Explain the procedure to request support from the NIC.
Ice Climatology
- On a map, show the geographical area seasonally affected by sea ice and icebergs.
- Recall the general time frame of when each of the geographical areas would see ice formation and melt.
- Describe current and forecast trends in sea ice extent.
Ice Physics
- Describe the processes affecting heat loss from a body of water.
- Describe the development of sea ice from first stage of ice crystal formation to an ice sheet.
- Describe the stages of sea ice melting.
- Given a description of winds and currents, estimate the drift of sea ice.
Ice Types
- Recall and define the WMO categories of sea ice.
- Describe the origin and classification of icebergs.
- Define the following terms:
- brash ice, fast ice
- fracture, lead, polynya
- ice edge, marginal ice zone, pack ice
- Describe the different elements of the ice code as used in the WMO egg code seen on ice charts.
- Describe coding for sea ice in a synoptic observation.
Detecting Ice
- Describe how sea ice is detected using environmental satellites
- Interpret a Daily Ice Edge Forecast for the Arctic Ocean or Bering Sea
- Identify the sea ice edge and marginal ice zone on NIC daily product.
Introduction
Introduction » Mission
The National Ice Center (NIC) is a three-agency organization of the United States Navy, the National Oceanic and Atmospheric Administration, and the United States Coast Guard. Its mission is to provide the highest-quality, timely, accurate, and relevant snow and ice products and services to meet the strategic, operational, and tactical requirements of United States interests across the globe.
This module will examine the role and products of the National Ice Center, along with basic information on sea ice and icebergs.
Introduction » Importance of Environmental Awareness
The Arctic region has become a focal point in the effort to understand and prepare for global climate change. Reduction in ice thickness and extent is widely expected to result in increased maritime activity in the region The “opening” of the Arctic and the sea routes that may be utilized represents the newest addition to the Navy’s global area of operations and responsibility.
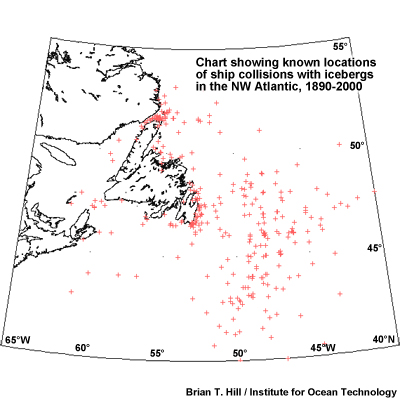
However, operating ships and submarines in and around sea ice raises significant safety considerations. Both sea ice and icebergs pose significant threats to vessels not fitted with ice hardened or ice-strengthened hulls.
This chart shows ship collisions with icebergs in the northwest Atlantic, spanning the years from 1890 to 2000.
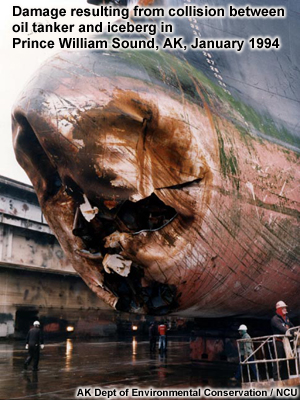
Many ships do not have ice-hardened or ice-strengthened hulls to properly operate in sea ice-infested waters. These ships must maintain a safe distance from the ice edge to ensure safe operations. This photo shows the result of a collision between an oil tanker and an iceberg in Prince William Sound, Alaska.
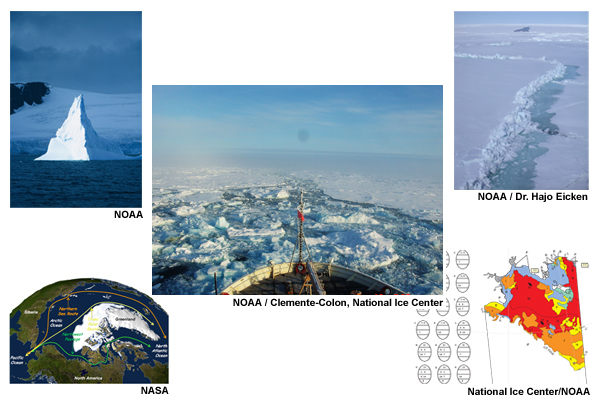
The National Ice Center monitors and charts the sea ice environment and provides operational support for US Navy, US Coast Guard, and NOAA units operating in and near sea ice infested waters.
Introduction » Areas Affected by Sea Ice

The Arctic and Antarctic Sea regions contain varying amounts of sea ice throughout the course of a year. This figure shows the average sea ice extent in March (left) and September (right), illustrating the climatological maximum and minimum sea ice extent. The top panels show the Arctic, while the bottom panels show the Antarctic.
Notice that during the month of March the ice extent is at its maximum for the Arctic and at its minimum for the Antarctic. In September the situation is reversed.
Introduction » Recent Changes in Sea Ice Extent
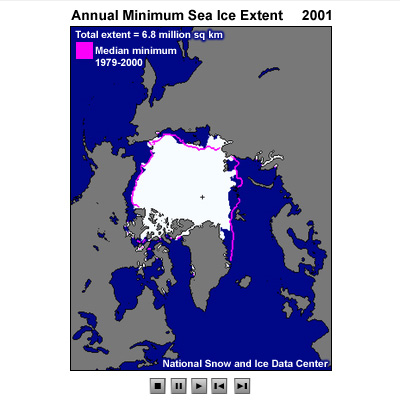
Click to play animation.
Since 2002, the minimum sea ice extent area in the Arctic has been experiencing near-record lows. This series of images shows September sea ice extent for the past few years. The purple line shows the median sea ice extent for the period 1980 to 2000. The recent years show a year-to-year persistence of minimum ice extents.
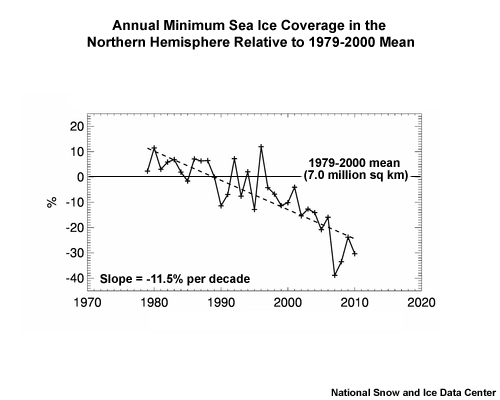
This graphic shows a time series of the area of pack ice for September over a 30-year period, from 1979 to 2010, relative to the 1979-2000 average. The dashed line shows the pack ice shrinking 11% per decade.
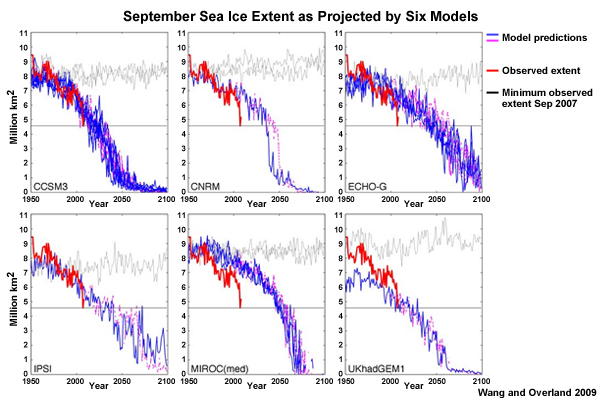
Sea Ice is expected to continue decreasing into the future. This graphic shows September sea ice extent as projected by six models. All six models show rapid decline in the ice extent that reaches an ice-free summer before the end of this century.
Introduction » Recent Changes in Ice Thickness
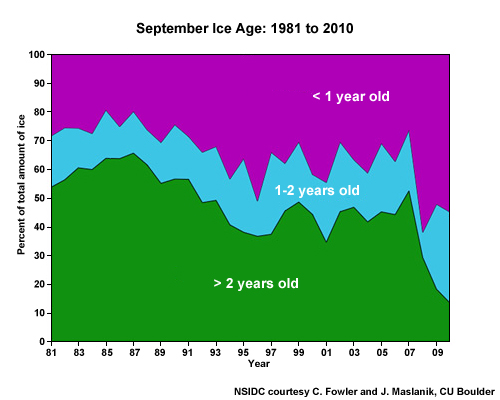
Not only is the areal extent of the ice pack getting smaller, it's getting thinner as well. This graph shows ice age for summer from 1981 to 2010. Multi-year ice, which has survived at least two summers' melt and is typically thicker than younger ice, has steadily decreased from over 50% to about 15% of the ice pack.
Introduction » Potential Shipping Routes
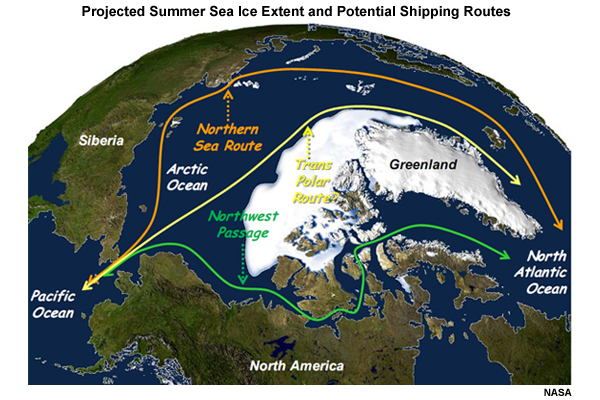
The loss of sea ice has huge implications for navigation in the Arctic Ocean. Using routes through the Arctic can significantly shorten shipping between ports on the Pacific and those on the Atlantic. This image shows potential trans-Arctic shipping routes. The Northern Sea Route and the Northwest Passage have already opened for short periods. Many anticipate a Trans-Polar route opening within our lifetime.
In addition to shipping, an ice-free Arctic will promote other activities including resource extraction, research, and tourism. These activities will present both great opportunities and challenges.
Ice Physics
Ice Physics » Heat Gain and Loss from a Body of Water
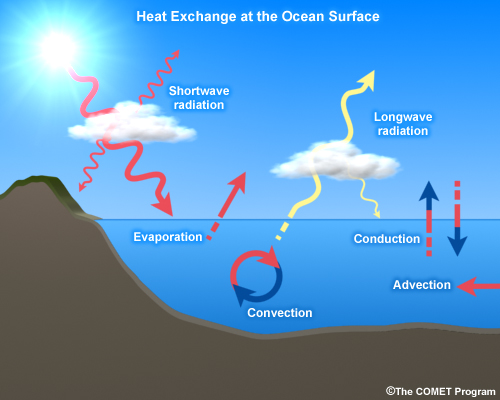
In order for water to freeze and form ice, it must cool to its freezing point.
The primary sources of heat in the Arctic Ocean are incoming shortwave radiation from the sun and warm currents from lower latitudes. Heat loss occurs primarily due to longwave radiation from the surface and evaporative heat loss.
In polar regions during the summer, the sun shines almost 24 hours a day. Incoming shortwave radiation exceeds outgoing longwave radiation and the water warms. In the fall, incoming solar radiation decreases, but outgoing radiation continues at about the same rate. When heat loss exceeds heat gain, the water cools. Thus, water temperature is primarily determined by the balance between incoming short-wave and outgoing longwave radiation.
Warm water advection is significant where the eastward extension of the Gulf Stream, the North Atlantic Current, flows up into the Norwegian Sea. This keeps the ocean several degrees warmer than it would be otherwise.
Evaporative cooling only occurs where seawater is exposed at the surface. Once a region is ice covered, evaporation is insignificant. However, there are areas where persistent winds push sea ice aside to expose seawater and remove vast quantities of heat and moisture. This process is most notable around Antarctica, but occurs in several locations around the Arctic.
Ice Physics » Formation of Ice in Sea Water
Ice Physics » Formation of Ice in Sea Water » Freshwater vs. Seawater
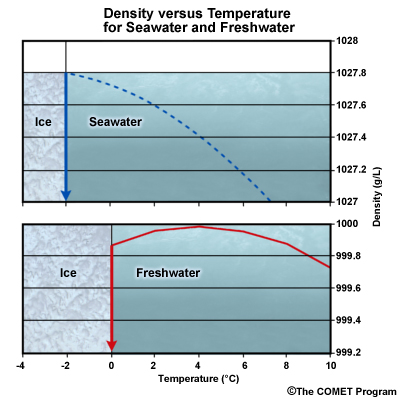
This graphic shows how density changes with temperature for both fresh water and seawater. In fresh water, the maximum density occurs at a temperature of 4°C (39°F). In the autumn, as surface water cools, it becomes denser and sinks. Warmer water from below replaces it. As freshwater cools below 4°C, it becomes less dense and convection ceases. This allows the surface water to freeze without cooling the entire body of water to the freezing point.
Seawater is different. Dissolved salt interferes with the freezing process, lowering the freezing point to -1.8°C. Seawater also gets denser as it cools, right down to its freezing point. However, this does not mean that the entire ocean must cool to -1.8°C before the surface can freeze.
Ice Physics » Formation of Ice in Sea Water »Freezing the Ocean
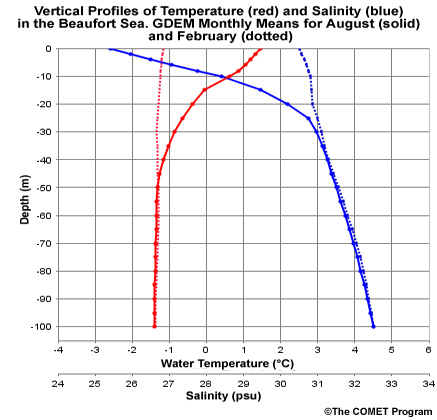
This graphic shows average vertical profiles of temperature and salinity for the months of August and February in the Beaufort Sea, north of Alaska. In August, seawater in the top 50 meters warms and freshens as one approaches the surface. By mid-winter in February, we see that the top 50 meters has cooled. Salinity is more uniform, but the seawater still freshens toward the surface.
In general, the mixed layer in the Arctic Ocean (the top 50 meters or so mixed by wind and waves) is warmer and less saline, and hence less dense than underlying water. Thus, as surface water cools, it sinks until the mixed layer has cooled to near the freezing point of seawater. Thus, only the mixed layer needs to cool to the freezing point, not the entire water column. With further cooling, ice starts to form at the surface. As ice forms, it excludes most of the salt from its crystalline structure. Ice is less dense than the seawater, so it floats.
Ice Physics » Questions
Question 1
Use the selection boxes to choose the answers that best complete the statement.
The correct answer is that over the course of a year, incoming shortwave radiation varies with the season, while outgoing longwave radiation is relatively constant. At the poles, shortwave radiation peaks in summer and is non-existent in the long polar night. Meanwhile, because longwave radiation depends on temperature, outgoing longwave radiation is relatively constant because ocean temperature is relatively constant.
Question 2
Because seawater gets denser as it gets colder, the ocean needs to cool to the freezing point before sea ice forms. (True or False)
The correct answer is False.
Only the mixed layer needs to cool to the freezing point before sea ice forms.
Sea Ice Formation and Classification
Sea Ice Formation and Classification » Frazil / Grease Ice
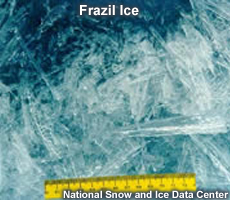
When ice starts to form on the surface in calm water, it initially forms small disks about the size of a pinhead (2-3 mm or 1/8 inch). As the ice continues to grow, it develops long, fragile arms akin to a snowflake. These arms inevitably break off resulting in a suspension of discs and arm fragments called frazil ice.
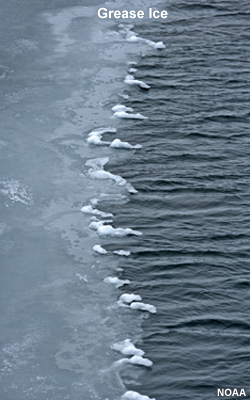
With continued freezing, the fragments composing frazil ice become more concentrated and coagulated to form a soupy layer on the surface called grease ice. Grease ice reflects little light, giving the water an oily/matte appearance.
Sea Ice Formation and Classification » Nilas
Click to play animation.
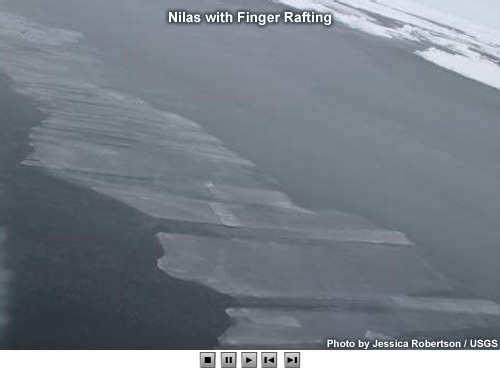
As freezing continues, the crystals forming grease ice freeze together to form a thin, elastic crust of ice called nilas. Nilas bends easily on waves and swell or under pressure. It grows in a pattern of interlocking "fingers" called finger rafting. Nilas has a matte surface and is up to 10 cm (4 inches) in thickness. When it is still thin and transparent, it appears grey and we call it dark nilas. As it thickens, its appearance lightens and we call it light nilas.
Sea Ice Formation and Classification » Young Ice
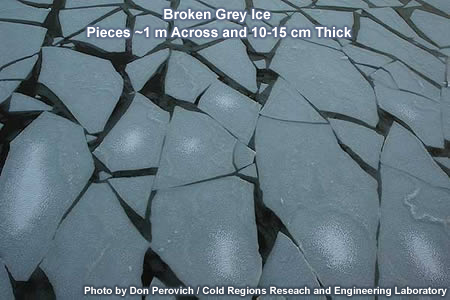
Once nilas has formed, sea ice grows from below with water freezing to the bottom of the existing ice sheet. Young ice that is 10-15 cm thick (4-6 inches) is called Grey Ice. It is less elastic than nilas and breaks on swells. It usually rafts under pressure, with one piece stacked horizontally upon another.
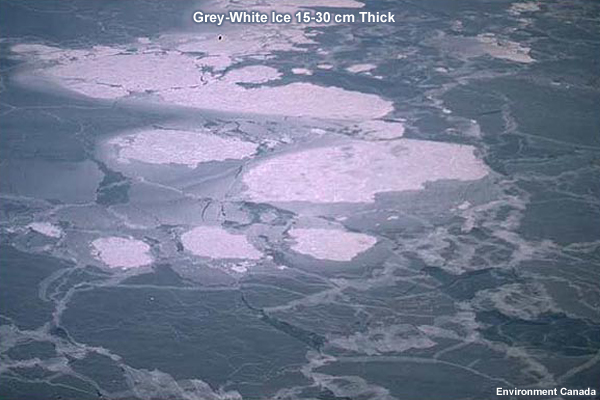
Young ice 15-30 cm thick (6-12 inches) is called Grey-White Ice. Under pressure it is more likely to form ridges than to raft.
Sea Ice Formation and Classification » Pancake Ice
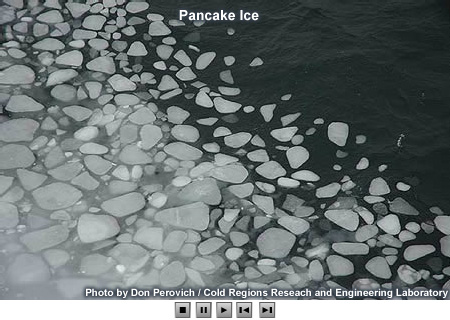
Click to play animation.
In rough water, such as in the Bering Sea or Greenland Sea, sea ice forms circular pieces called pancake ice. The rounded shape results from pieces striking against one another. Pancake ice may form on a slight swell from grease ice or slush. In rougher water, it may result from the breaking of nilas or even grey ice. At the ice edge, the pancakes are only a few cm in diameter. Moving away from open water, the pancakes grow in size and thickness. They typically range in size from 30 cm to 3 m in diameter and up to 10 cm in thickness, with raised rims.
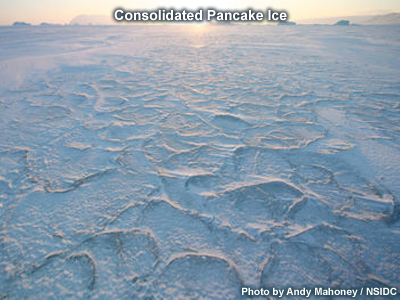
With enough distance from the ice edge, the wave field calms, and the pancakes freeze together in groups. First they form large floes, then eventually a continuous sheet of young ice known as consolidated pancake ice.
Sea Ice Formation and Classification » First-year Ice
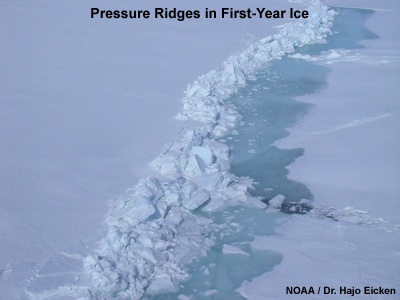
First-year Ice is 30 cm (12 inches) or more thick and develops from young ice over one winter. First year ice tends to be rather flat with steep, fresh pressure ridges, like that shown here.
We subdivide first-year ice as thin, medium, or thick based on its thickness.
- Thin First-year Ice/White Ice: 30-70 cm (12-28 inches) thick.
- Medium First-year Ice: 70-120 cm (28-48 inches) thick.
- Thick First-year Ice: Greater than 120 cm (48 inches) thick.
Sea Ice Formation and Classification » Ice Birthday
At the end of summer, when the ice pack reaches its minimum, some ice will have melted and some ice will still remain after one complete year. The National Ice Center labels this day as the "ice birthday". The ice birthday for the Northern Hemisphere takes place on or around October 1st and for the Southern Hemisphere it takes place on or around April 1st.
Sea Ice Formation and Classification » Brine Exclusion
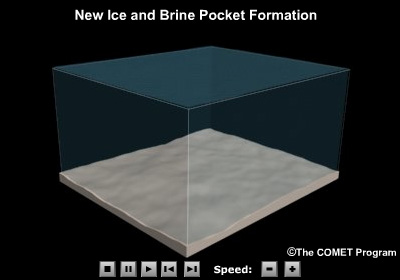
Click to play animation.
Important structural changes take place over time within sea ice. This animation illustrates a process called "brine exclusion", which gradually takes place as first-year sea ice transitions into multi-year ice.
As ice forms from sea water, it excludes salt from the crystal structure. The salt gets concentrated in pockets of brine. Because the brine is relatively dense and has a lower freezing point, it gradually works its way toward the bottom of the ice layer. As the brine solution drains from the bottom of the sea ice, it leaves behind empty pockets and vertical tubes.
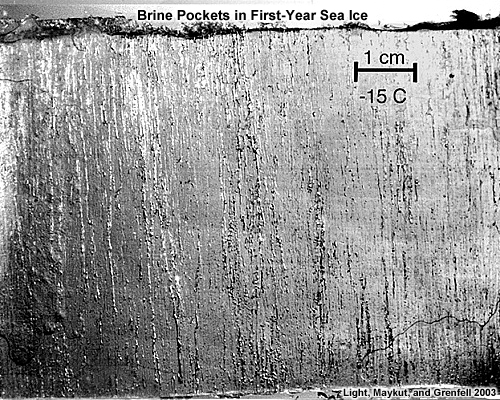
This image shows a vertical slab of first year ice at a depth of about 80 cm (32 inches). Note the vertical tubes formed by the escape of brine.
Sea Ice Formation and Classification » Old Ice
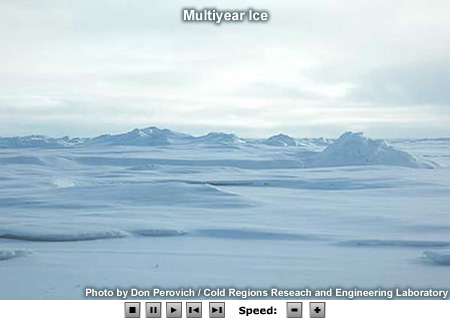
Click to play animation.
Sea ice that has survived at least one summer's melt is called old ice. Compared to first-year ice, it has a hummocky, irregular topography and features are generally smoother.
The processes that expel salt from the ice continue, making old ice fresher and much stronger than first- year ice. As a result, old ice presents a danger to navigation and a formidable barrier for icebreakers.
Old ice may be subdivided into second-year ice and multi-year ice.
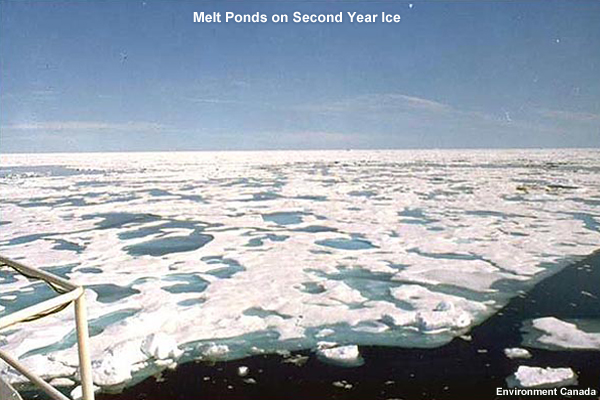
Second-year Ice has survived only one summer's melt. Thicker than first-year ice, it stands higher out of the water. In contrast to multi-year ice, summer melting produces a regular pattern of numerous small puddles.
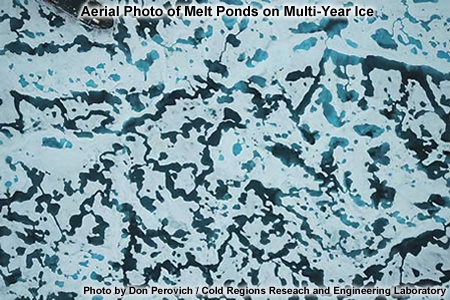
Multi-year Ice has survived at least two summers' melt. Growth continues from year to year until the ice thickness reaches up to 3 m (10 ft) or more. Hummocks are smoother than on second-year ice and the ice is almost salt-free. The melt pattern consists of large interconnecting, irregular puddles with a well-developed drainage system.
Sea Ice Formation and Classification » Fast Ice
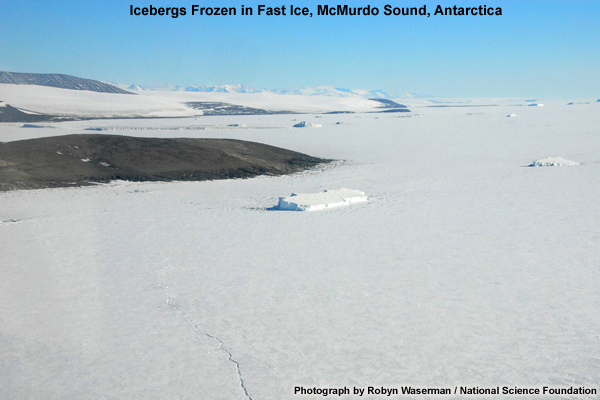
Fast ice is anchored to shore or the sea floor and doesn't drift with winds or currents. It typically occurs along the coast over shallow continental shelves in water up to 20 meters deep. It can form from either ice that freezes in place or from sea ice that drifted in close to shore and anchored there.
Sea Ice Formation and Classification » Brash Ice
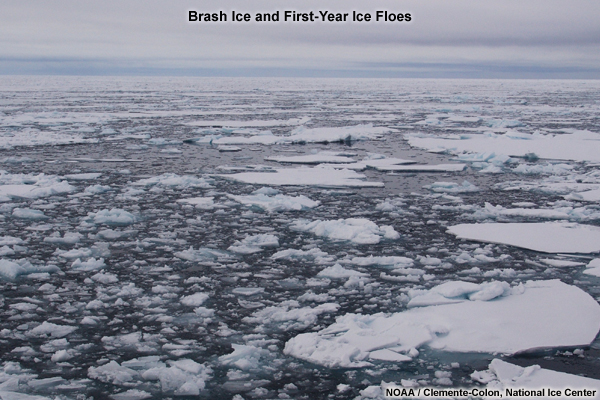
Brash ice is an accumulation of floating ice made up of fragments not more than 2 meters across, derived from the wreckage of other forms of ice. Brash is common between colliding floes or in regions where pressure ridges have collapsed.
Sea Ice Formation and Classification » Questions
Question 1
For each of the sea ice photos below, select the name that best describes it. (Use the selection box to choose the answer).
Correct answers are shown beneath the images.
Question 2
Reorder (drag-and-drop) the ice classifications to their sequence of formation from first to last.
Question 3
Use the selection boxes to complete the following sentence.
Question 4
Which moves more, brash ice or fast ice? (Choose the best answer.)
The correct answer is (a) Brash ice.
Brash ice is an accumulation of floating ice fragments, typically found amongst floes or in leads or fractures. Fast ice, despite its "speedy" name, is fastened to either the coast or the seafloor.
Melting of Sea Ice
As sea ice melts, it undergoes four stages, based on both the visual and physical characteristics of the ice at each stage:
- Snow melt
- Puddling
- Drainage
- Rotten Ice
Melting of Sea Ice » Snow Melt
Snow melt is the first stage of ice melt. In response to warming from the sun, liquid water begins to accumulate within the snow covering the ice. As water accumulates within the snow, the ice below begins to warm. As water accumulates and the snowpack thins, less light is reflected and more is absorbed, which increases melting.
Melting of Sea Ice » Puddling
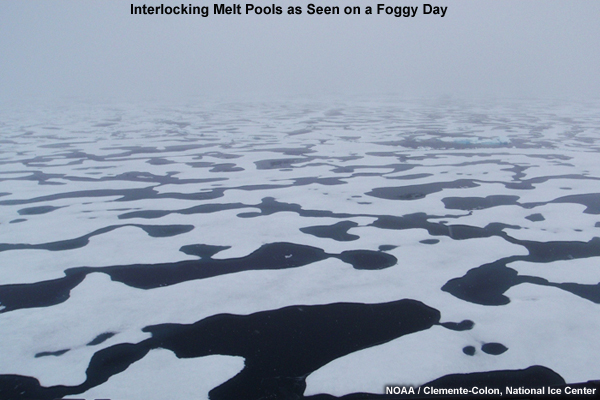
Puddling is the second stage of ice melt. During puddling, the snow cover thins and melt water forms puddles on the surface of the sea ice. Puddles form first where the snow is the thinnest, where level ice is exposed, or where melt water accumulates after draining off higher features. Once formed, the puddles absorb much more solar radiation than the surrounding ice, which accelerates the melting.
In the puddling stage, the temperature of the sea ice increases and eventually warms to an isothermal state just below the freezing point. In response, the volume of the brine cells increases substantially, making the ice more porous and hence weaker.
Melting of Sea Ice » Drainage
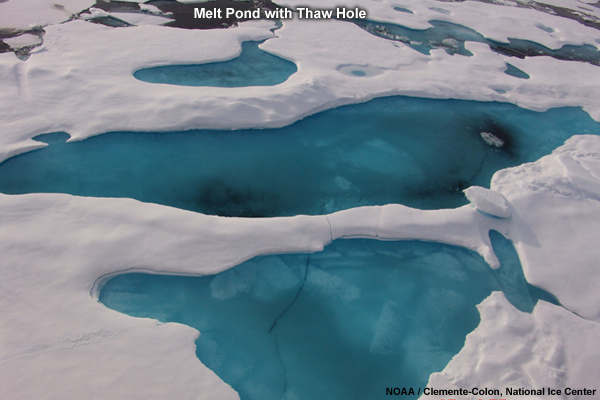
During the third stage of ice decay, drainage, the melt water begins to drain through brine drainage channels as well as through cracks, thaw holes, and off the edges of floes. The ice between the melt puddles is well-drained and has a white surface.
Thaw holes pass through the sea ice to the ocean below. They form through a feedback mechanism where the larger melt ponds preferentially absorb more warmth from the sun. In addition, sunlight passes through the melt pond and sea ice and warms the seawater below, so that the ice melts from beneath as well as above. Development of a thaw hole can result in sudden drainage of large areas of pack ice.
Water draining through brine channels drives out much of the remaining brine. This process, called flushing, removes nearly all of the remaining brine from the first-year ice, leaving behind an ice sheet much reduced in salinity and very porous.
Melting of Sea Ice » Rotten Ice
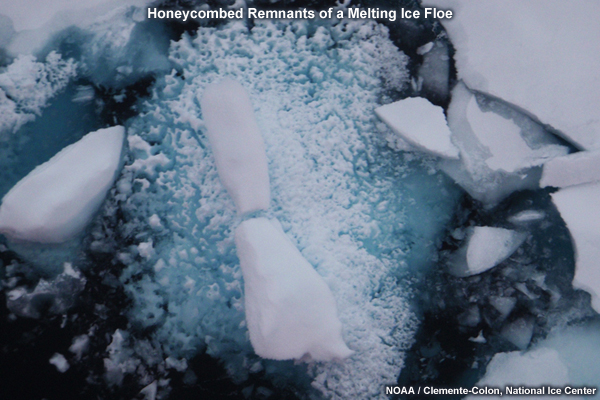
The final stage of melting is rotten ice. The ice has broken up in an advanced state of disintegration. It contains open brine drainage channels and takes on a “honeycombed” structure, like that shown here, resulting in very weak ice.
Melting of Sea Ice » Questions
Question 1
Reorder (drag-and-drop) the melting stages to their sequence of occurrence.
Question 2
Thaw holes develop and flushing occurs during which stage of melting? (Choose the best answer.)
The correct answer is (a) Drainage.
Prior to drainage, puddles develop. After drainage occurs, the ice gets rotten and disintegrates.
Question 3
Does summer melting increase or decrease the salinity of sea ice? (Choose the best answer.)
The correct answer is (b) Decrease.
When sea ice forms, salt is mostly expelled and gets concentrated in brine pockets. The brine is dense and has a very low freezing point, so it tends to migrate downward. Warming temperatures in the summer accelerate this process. Flushing from melted sea ice completes the process, leaving the sea ice nearly salt free.
Synoptic Influences on Ice
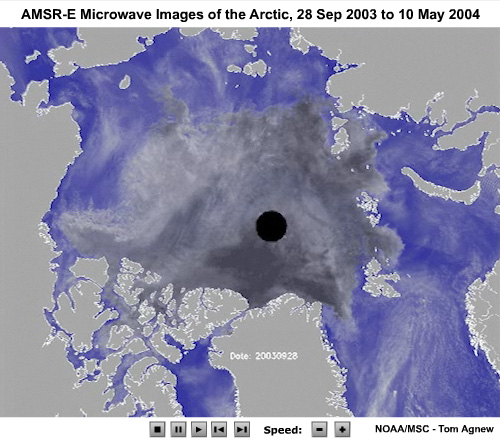
Click to play animation.
Sea ice does not simply grow and melt in one place. Sea ice is almost continually in motion, except in coastal regions where fast ice grows out from, and stays attached to, the shore. In this animation, sea ice shows up as various shades of grey and open ocean as blue. In general, lighter shades of grey are newly formed first-year ice and darker shades of grey are older multi-year ice. The motion of large ice floes and the formation leads can be seen quite well, especially during the winter months. The faster moving clouds should be ignored.
Synoptic Influences on Ice » Wind
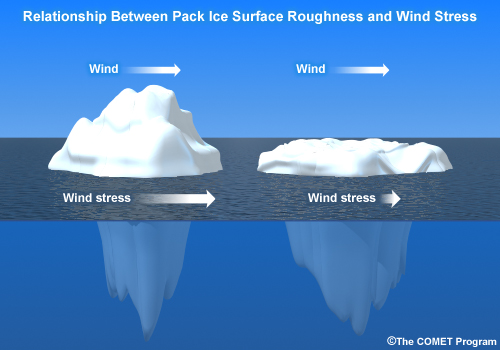
Wind is one of the primary forces responsible for ice motion, particularly at the time scale of days or weeks. Wind blowing across the sea ice generates drag that causes the ice to drift. The amount of drag depends on the wind speed and the roughness of the sea ice surface. A rough ice surface generates more drag, and hence more drift. The relationship between wind and sea ice drift is so strong that a general guideline can be applied: sea ice that drifts freely moves at about 2% of the wind speed. The direction depends on the size of the sea ice moving; larger pieces of sea ice move at the higher range of 20 to 40 degrees to the right (Northern Hemisphere) or left (Southern Hemisphere) of the wind direction. Other factors also contribute to sea ice free drift, but this simple relationship accounts for up to 70 percent of sea ice motion on a daily to weekly basis.
Synoptic Influences on Ice » Wind » Question 1
Question
Using the relationships described previously, where will a large ice flow in the Greenland Sea drift after 10 hours of 20 kt winds (10 m/s) from the south? (Choose the best answer.)
The correct answer is (d) 4 nautical miles to the north-northeast.
10 hours x 20 kt = 200 nm. 2% of 200 nm = 4 nm. Because this is the Northern Hemisphere, wind from the south (180°) will blow the ice flow about 30° to the right of north (0°). 0° + 30° = 30° (roughly north-northeast).
Synoptic Influences on Ice » Wind » Question 2
Question
Suppose a large ice flow is drifting freely near Antarctica. It experiences a 5-day storm with an average wind speed of 30 kt from the west. Where does it drift? (Choose the best answer.)
The correct answer is (c) 72 nmi to the east- northeast.
5 days x 24 hours/day x 30 kt = 3600 nmi. 2% of 3600 nmi = 72 nmi. Because this is the Southern Hemisphere, wind from the west (270°) will blow the ice flow about 30° to the left of east (90°). 90° - 30° = 60° (roughly east-northeast).
Synoptic Influences on Ice » Currents
Currents also drive sea ice. In calm air and open seas, ice will move at current speed. Similar to wind, the effect of current on ice motion depends on the underwater roughness and the current speed. As wind speed and ice concentration increase, we need to account for their effects.
There are different sorts of currents in the ocean that affect sea ice differently.
- Permanent currents, like the Labrador Current, tend to be relatively steady and have their greatest effect farther from shore. These currents account for the long-term motion of ice.
- Tidal currents tend to be periodic, changing direction every 12 to 24 hours, and have their greatest effect near shore, where they can reach relatively high velocities (5 kt or more).
- Temporary currents, forced by the wind. These currents occur everywhere, but tend to be rather shallow. Thus, they tend to affect the shallow sea ice more than the deep icebergs.
Synoptic Influences on Ice » Wind and Currents
When determining the motion of sea ice, the effects of both wind and currents must be accounted for. This can be done by adding the effects of both wind and currents using vector addition.
For example, suppose we have the following conditions in the Arctic:
Wind: 25 kt from 30° west of north (330°)
Current: 0.5 kt to the east (90°)
Question
What will be the resulting ice drift after 10 hours? (Choose the best answer.)
The correct answer is (b) 7 nmi Southeast.
Distance due to wind = 25kt x 10hr x 2% = 5nmi
Direction due to wind: Wind from 330°. Ice moves toward (330°-180°) + 30° to the right (Northern Hemisphere) = 180° = Due south
Distance due to current = 0.5kt x 10hr = 5 nmi
Direction due to current = Due east
Wind + Current:
5 nmi south + 5 nmi east = ~7 nmi southeast.
For a quick review of vector addition, see the following website:
http://www.grc.nasa.gov/WWW/K-12/airplane/vectadd.html.
Synoptic Influences on Ice » Ice Concentration
As the ice concentration increases, the motion of the ice pack slows down. Collisions between ice floes result in ice ridges and other deformation features that absorb and dissipate energy, slowing down the overall motion of the pack ice. All else being equal, sea ice in open water with a concentration less than 30% will move 2-3 times faster than pack ice with a concentration greater than 80%.
Synoptic Influences on Ice » Forecasting Rules-of-Thumb
Ice drift is an important input in the analysis and forecasting of ice conditions. The following six rules-of-thumb have been developed for estimating ice drift:
- Ice will drift parallel to the surface isobars, which is slightly to the right of the wind direction in the Northern Hemisphere and slightly to the left in the Southern Hemisphere.
- Ice will drift with a speed about 2 to 3% of the wind speed.
- Ice drift in nautical miles per day is approximately 50% of the wind speed in knots.
- The speed of the ice drift increases with its surface roughness.
- The speed of the ice drift decreases with concentration.
- To estimate ice drift in the presence of a water current, use the above rules to estimate the effect of the wind, and then use vector addition to add the effect of the current.
The drift of icebergs, in contrast, is driven predominantly by the flow of subsurface water currents due to their larger draft. Therefore, knowledge of the general currents in a region should be the primary input when estimating iceberg drift.
Synoptic Influences on Ice » Difference Between Drift of Sea Ice and Icebergs
Sea ice tends to move faster than icebergs, due to its shallower draft. This occurs whether the ice is driven by wind or currents.
- Under the influence of wind, the deep draft of icebergs generates more drag and tends to slow them down when compared to the shallow draft of sea ice.
- Under the influence of currents, the deep draft of icebergs averages the effects of shallow currents and deeper currents. Because most surface currents are wind generated, they decrease rapidly with depth. Sea ice is driven by the faster surface currents, while icebergs average the fast surface currents with deeper, slower currents.
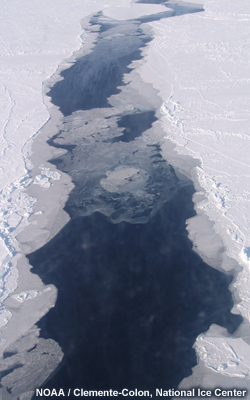
Fractures, Leads, and Polynyas
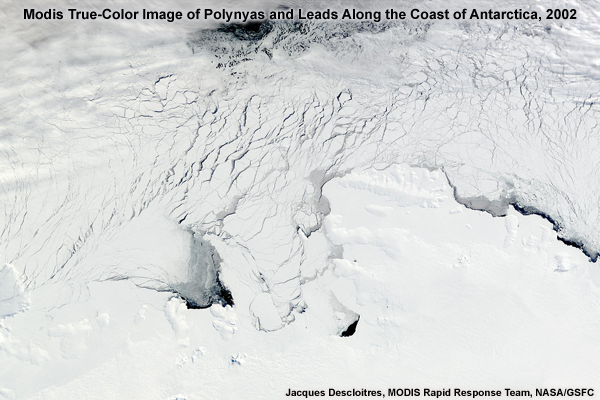
One consequence of wind and currents is that openings occur within the ice pack, exposing seawater between ice floes. We classify these openings as fractures, leads or polynyas depending on their size, shape, and how they form. This satellite image shows both polynyas and leads.
Fractures, Leads, and Polynyas » Significance of Fractures, Leads, and Polynyas
Click to play animation.
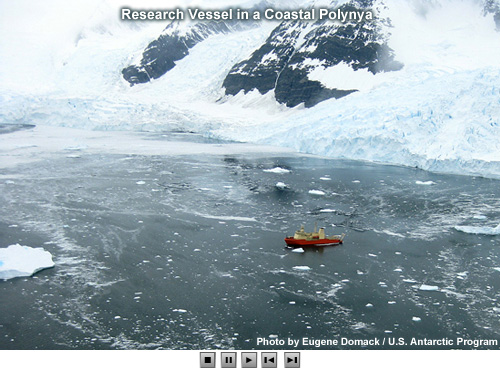
Fractures, leads and polynyas are important both operationally and ecologically. They allow ships to operate and submarines to surface. They also provide habitat for seabirds and marine mammals like whales and seals.
Fractures, Leads, and Polynyas » Fractures
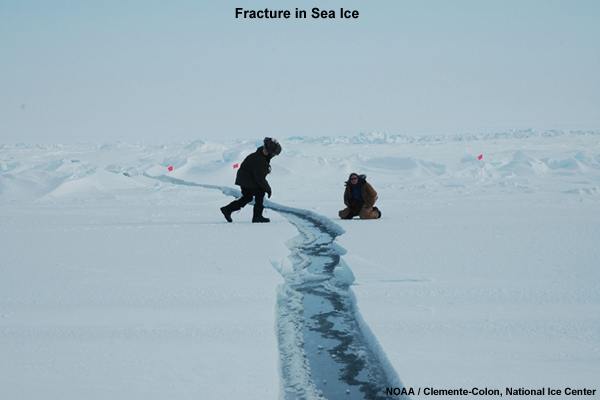
A fracture is a break through pack ice that results from deformation processes. Fractures, by definition, are too narrow to be navigated by surface vessels. The surface of the ice may be covered with thin ice, like nilas. Fractures can range in length from a few meters to several kilometers.
Fractures, Leads, and Polynyas » Leads
In contrast, a lead is a fracture that is wide enough to be navigable by surface vessels. Generally, the term is applied to linear features. A lead between the shore and the pack ice is called a coastal lead or shore lead, and a lead between the fast ice and the pack ice is called a flaw lead.
Fractures, Leads, and Polynyas » Latent Heat Polynyas
Polynyas refer to nonlinear shaped openings in the pack ice. Again, they may be covered by nilas or thin ice. Polynyas may be quite large: up to 10s of kilometers across. There are two main categories of polynyas based on how they form: latent heat polynyas and sensible heat polynyas.
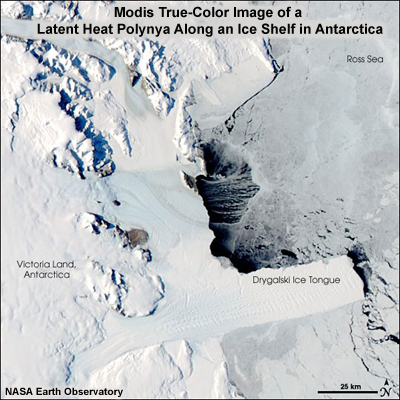
Latent heat polynyas form when persistent winds create openings in the ice, usually close to shore. This satellite image shows a polynya that opened along an ice shelf in Antarctica. Note the cloud streets that form as strong katabatic winds stream offshore. These clouds are one indication of the large amount of heat and water vapor rising from the exposed water. The winds also keep moving the ice offshore, keeping the coast relatively ice free.
Fractures, Leads, and Polynyas » Sensible Heat Polynyas
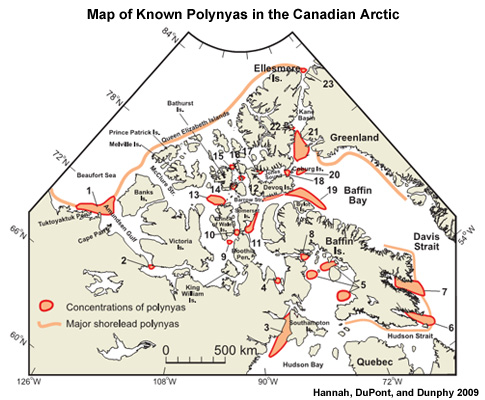
Sensible heat polynyas are maintained by upwelling warm water that supplies a sufficiently large oceanic heat flux to the base of the ice to reduce its thickness, or melt it completely. Such upwelling is caused by some combination of currents and bathymetry. As a result, these polynyas tend to form in the same locations every year. This map shows the location of over twenty polynyas that form in the Canadian Arctic almost every year.
Fractures, Leads, and Polynyas » Questions
Question 1
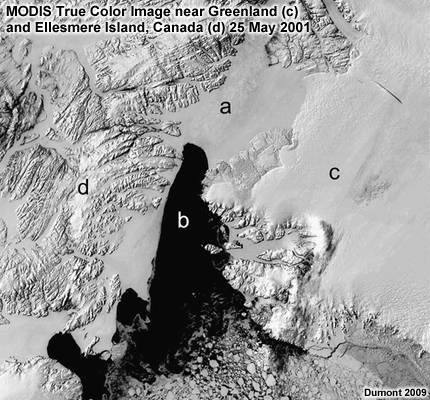
Which of the following is shown at location "b" in this satellite image? (Choose the best answer.)
The correct answer is (d) polynya.
The image shows the North Water Polynya, that forms every year in Northern Baffin Bay. Fractures and leads are both narrow, linear features. This particular polynya forms every year when Nares Strait, to the north, freezes over. Wind and currents from the north, push sea ice away from the southern end of Nares Strait, leaving open water.
Question 2
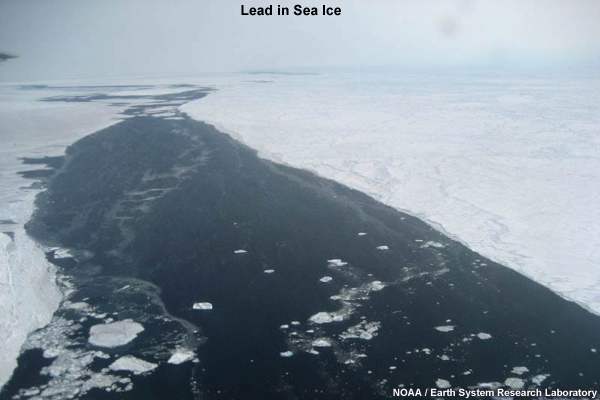
Which of the following is shown in this aerial photograph? (Choose the best answer.)
The correct answer is (b) Lead.
Fractures and leads are linear openings in the sea ice, while polynyas are non-linear. Fractures are too small to navigate in a boat, while leads are large enough to do so. While there is no scale on the photo, pressure ridges provide some perspective. It is apparent that this opening in the sea ice is linear and large enough to navigate, thus it is a lead.
Icebergs
 All icebergs can be dangerous to ships — massive icebergs can cause great damage, but smooth, submerged ones are perilous because they are hard to detect and avoid. In the North Atlantic, most icebergs originate from the tidewater glaciers of Western Greenland.
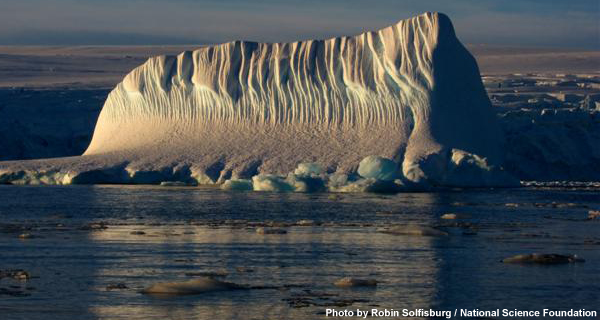
Icebergs » How are icebergs formed?
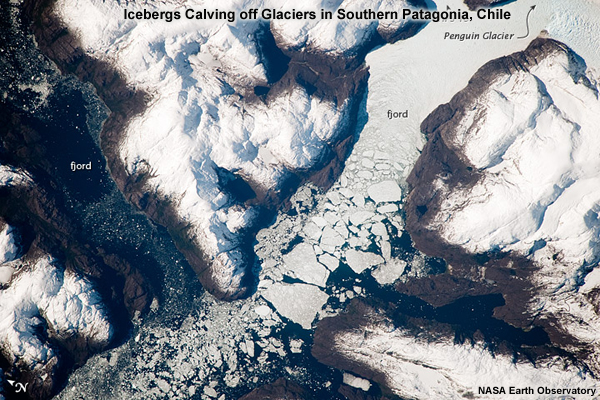
Icebergs are blocks of fresh-water ice that break off from glaciers and float out to sea. Glaciers are formed in polar regions where snowfall lasts for centuries, or even millennia, without entirely melting. As new snow falls at the surface, deeper snow is compressed. With continued burial, the increasing pressure eventually transforms snow into a dense ice. The building weight causes the ice to flow down valleys to the coast. At the coast, chunks of ice break off (or calve) and float out to sea, creating icebergs. This photograph shows the icebergs that formed where a glacier flowed into a fjord in Patagonia, Chile.
Icebergs form a never-ending range of shapes and sizes. Explorers have written vivid descriptions of the color and beauty of icebergs, and compared them to towers, spires, pyramids, cathedrals, and palaces. Due to the processes of calving and decay, the shape and size of an iceberg changes throughout its lifetime.
There is little human beings can do to control icebergs. It is difficult to destroy an iceberg by blasting, or to steer it into a different course which would take it out of an ocean shipping lane. It is even difficult to approach an iceberg, because the submerged parts may tear open a ship's bottom.
Icebergs » Icebergs Classification
Icebergs » Icebergs Classification » Size
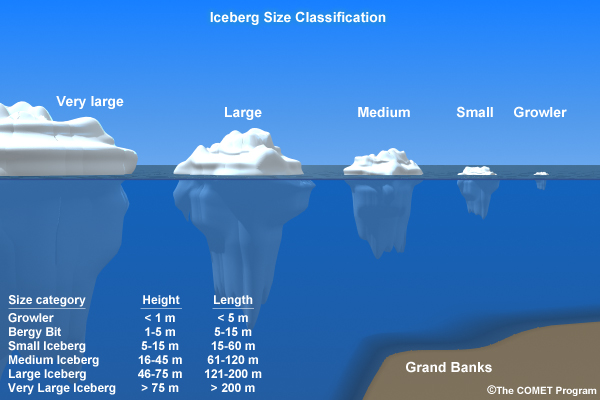
Icebergs are classified by their size and above-water shape. The International Ice Patrol (IIP) uses the following size classification:
| Size Category | Height | Length |
|---|---|---|
| Growler | Less than 1 m (3.3 ft) | Less than 5 m (16 ft) |
| Bergy Bit | 1–5 m (3.3–16 ft) | 5–15 m (16–49 ft) |
| Small | 5–15 m (16–49 ft) | 15–60 m (49–200 ft) |
| Medium | 15–45 m (49–148 ft) | 60–120 m (200–390 ft) |
| Large | 45–75 m (148–246 ft) | 120–200 m (390–660 ft) |
| Very Large | Over 75 m (246 ft) | Over 200 m (660 ft) |
Icebergs » Icebergs Classification » Shape
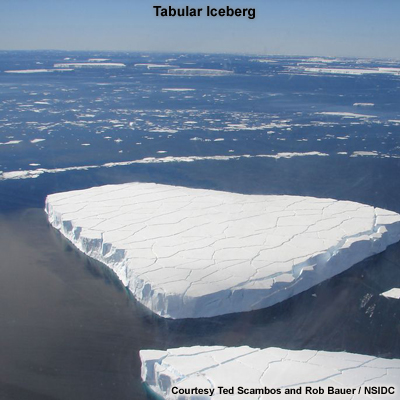
The International Ice Patrol (IIP) classification of iceberg shape starts with tabular versus non-tabular. Tabular icebergs have steep sides and a flat top with a length-to-height of 5:1 or more. Most show horizontal banding.
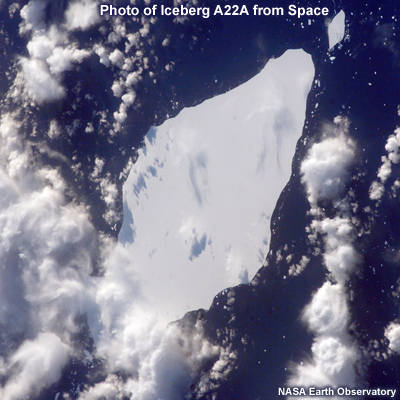
Tabular icebergs can be quite large, up to thousands of square kilometers in area. This photo from space shows an iceberg that measures 50 by 23 km.
Non-tabular icebergs come in a wide variety of shapes, which the IIP classifies as follows:
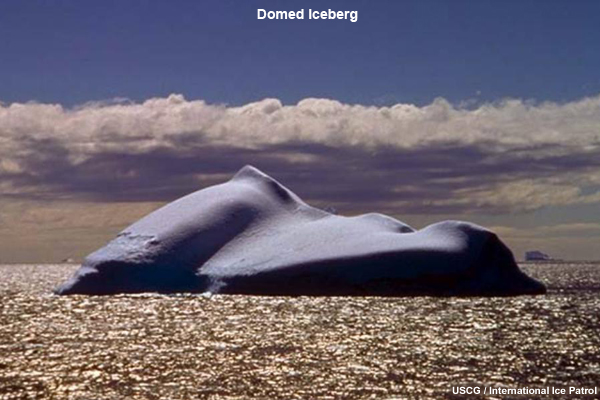
- Domed: An iceberg with a rounded top.
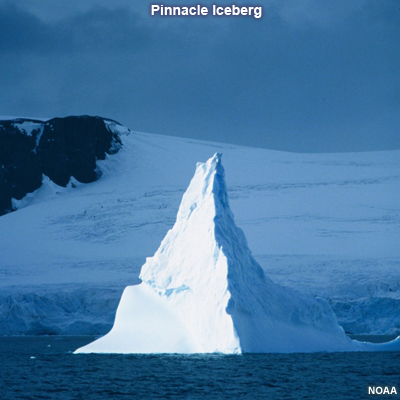
- Pinnacle: An iceberg with one or more spires.
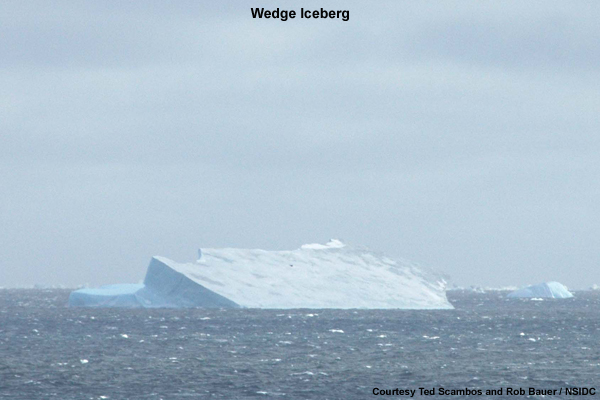
- Wedge: An iceberg that is rather flat on top and with a steep vertical side on one end, sloping down to the other end.
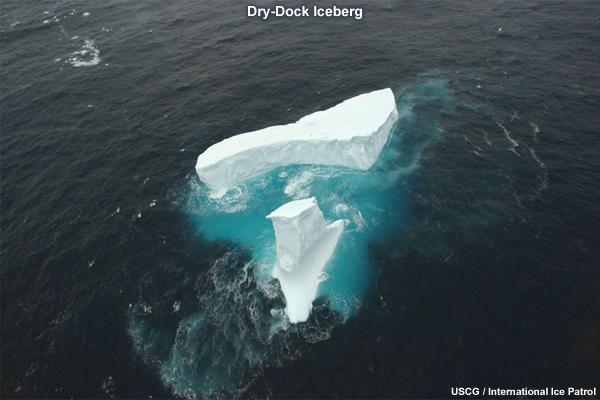
- Dry-Dock: An iceberg which is eroded such that a U-shaped slot is formed near or at water level, with twin columns or pinnacles
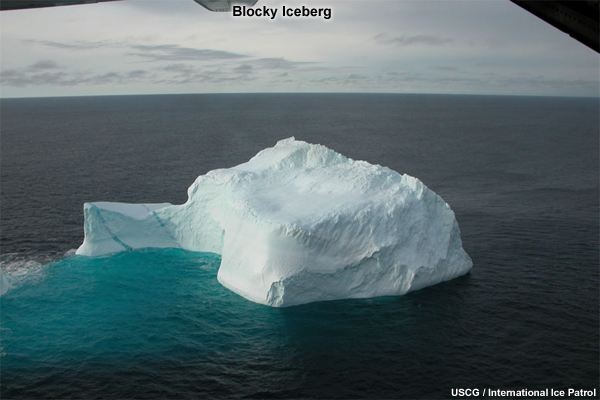
- Blocky: An iceberg with steep, vertical sides and a flat top. It differs from tabular icebergs in that its shape is more like a block than a flat sheet.
Icebergs » Questions
Question
For each of the iceberg photos below, select the name that best describes it. (Use the selection box to choose the answer).
Correct answers are shown beneath the images.
Icebergs » International Ice Patrol
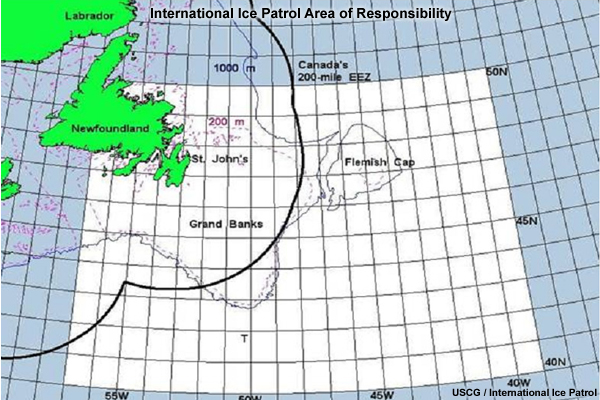
The International Ice Patrol (IIP) was formed after the RMS Titanic sank on 15 April 1912. Since 1913, except for periods of World War, Ice Patrol has monitored the iceberg danger on and near the Grand Banks of Newfoundland and has broadcasted the Limit of All Known Ice (LAKI) to mariners. This map shows the area patrolled by the IIP. T marks the location where the Titanic sank.
The IIP’s ice season generally runs from 15 Feb to 01 July. After this, the Canadian Ice Service produces the daily chart from July to the beginning of February. The National Ice Center, Canadian Ice Service (CIS) and USCG IIP form the North American Ice Service (NAIS) and the iceberg charts are produced as a NAIS product.
The IIP conducts aerial reconnaissance from St. John’s, Newfoundland to search for icebergs. In addition to IIP reconnaissance data, Ice Patrol receives iceberg reports from other aircraft and mariners in the North Atlantic. NAIS Personnel then analyze iceberg and environmental data and use the iceBerg Analysis and Prediction System (BAPS) computer model to predict iceberg drift and deterioration. Based on the model’s prediction, NAIS produces an ice chart and text bulletin.
Daily ice bulletins are available through the IIP website or the JAAWIN (Joint Air Force and Army Weather Information Network) web site.
Text Note:
International Ice Patrol Website: http://www.uscg-iip.org
JAAWIN Website: http://www.afweather.af.mil/
Canadian Ice Service: http://ice-glaces.ec.gc.ca/
Icebergs » International Ice Patrol » Daily Products

This is an example of the Daily Ice Chart produced by NAIS. The solid line is the Limit of All Known Ice (LAKI). The dashed line is the limit of sea ice. The individual numbers show the number of icebergs in a 1 x 1 degree cell. Recall that one degree of latitude spans about 110 km (~70 mi).
Question 1
What is the maximum number of icebergs in a single 1 x 1 degree cell? (Enter your response and click Done.)
Answer
The correct answer is 99!
Question 2
How far south does the Limit of all known ice extend? (Enter your response and click Done.)
Answer:
The correct answer is 41°N. That's as far south as New York City.
Icebergs » International Ice Patrol » Climatology Products
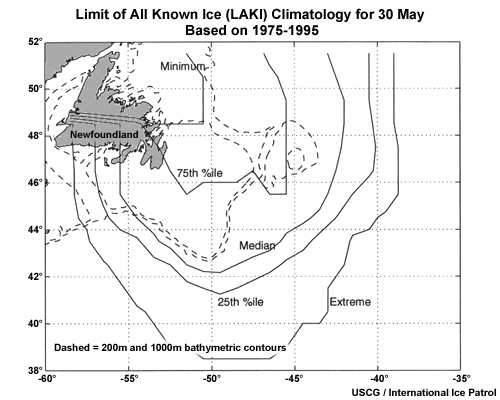
The IIP also compiles iceberg climatology data. This chart shows data for May 30 limit of all known ice (LAKI). The median LAKI extends south to 42°N, but in the extreme case, ice extends south to almost 38°N, about the latitude of Delaware Bay. Under these conditions, ships would traveling from New York to Northern Europe would expect to alter their route to avoid icebergs.
NIC Products
The National Ice Center offers a suite of products targeted at mariners navigating polar waters.
NIC Products » Daily Ice Edge
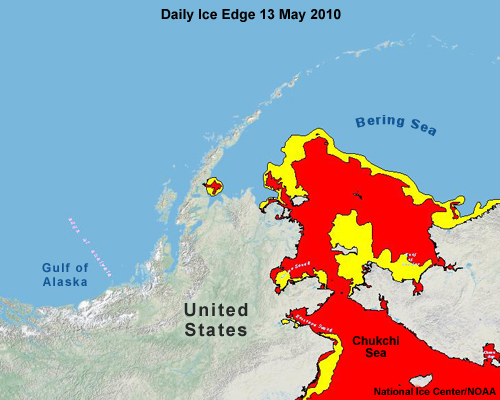
The NIC produces an extensive analysis of the Arctic and Antarctic ice edge and marginal ice zone, utilizing multiple sources of satellite imagery in the production process (as discussed later). Marginal ice, shown in yellow, denotes an ice concentration from the ice edge (1/10th) to the pack ice (8/10ths). Pack ice, shown in red has an ice concentration that exceeds 8/10ths.
The US Navy utilizes this product for its submarine and surface force as well as ice modeling efforts.
NIC Products » Regional Ice Analysis
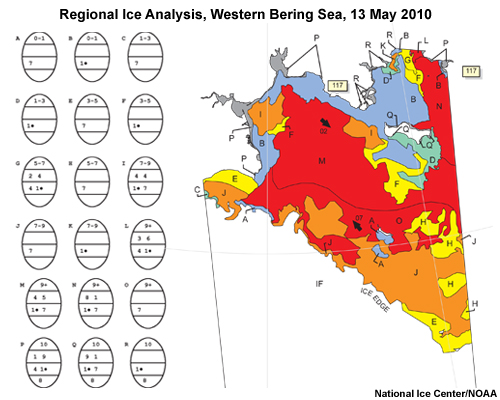
The NIC conducts a comprehensive analysis of the Arctic and Antarctic on a rotating biweekly basis. The analysis shown here comes from the Bering Sea. Ice location, types, and concentrations are analyzed. This information is expressed using the World Meteorological Organization (WMO) egg code (explained later in the module). Areas of high interest around Alaska, including the Beaufort, Chukchi, and Bering Seas, and Cook Inlet, are analyzed on a weekly basis. Support customers include the National Weather Service (NWS) office in Anchorage and the United States Coast Guard (USCG) District 17 Headquarters in Juneau.
NIC Products » Regional Ice Analysis » Egg Code
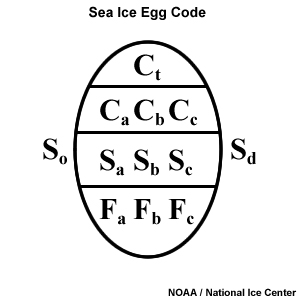
In many ice analyses, data is presented using the WMO egg code. The egg code describes sea ice in some region by its concentration (C), stage (S) of development, and the form (F) of the ice.
Ct is the total concentration of ice in the area, expressed in tenths. Thus if you see a 5 in this field, it means that 5/10 of the sea surface is covered with ice. Ct may be expressed as either a single number or a range (for example, 3-5).
Ca, Cb, and Cc are the partial concentrations of different ice types. These are always expressed as a single digit. These are reported in order of decreasing thickness. Thus, Ca is the concentration of the thickest ice and Cc is the concentration of the thinnest ice.
| Stage of Development for Sea Ice | Code Figure |
|---|---|
New Ice-Frazil, Grease, Slush, Shuga (0-10 cm) |
1 |
Nilas, Ice Rind (0 - 10 cm) |
2 |
Young (10 - 30 cm) |
3 |
Grey (10 - 15 cm) |
4 |
Grey - White (15 - 30 cm) |
5 |
First Year (30 - 200 cm) |
6 |
First Year Thin (30 - 70 cm) |
7 |
First Year Thin - First Stage (30 - 70 cm) |
8 |
First Year Thin - Second Stage (30 - 70 cm) |
9 |
Medium First Year (70 - 120 cm) |
1• |
Thick First Year (>120 cm) |
4• |
Old - Survived at least one season's melt (>2 m) |
7• |
Second Year (>2 m) |
8• |
Multi-Year (>2 m) |
9• |
Ice of Land Origin (Icebergs) |
 |
U.S. National Ice Center |
|
Sa, Sb, and Sc describe the stage of development, in decreasing order of thickness, using the code shown in his table. These codes correspond directly with the partial concentrations above. Thus, Ca is the concentration of stage Sa., Cb is the concentration of stage Sb, and Cc is the concentration of Sc. Notice that older, thicker ice carries a dot (•) after the number. Thus, while 4 signifies grey ice, 10-15 cm thick, 4• Represents thick first year ice, over 120 cm thick. To further complicate matters, if there is a dot, all stages of development codes to the left of the dot are assumed to carry the dot.
So and Sd are the development stage of remaining ice types and lie outside of the egg. These fields are optional. So is used when there is only trace of an ice type thicker/older than Sa. Sd is a thinner ice type that is reported when there are four or more ice thickness types.
| Forms of Sea Ice | Code Figure |
|---|---|
New Ice (0-10 cm) |
X |
Pancake Ice (30 cm - 3 m) |
0 |
Brash Ice (< 2m) |
1 |
Ice Cake (3 - 20 m) |
2 |
Small Ice Floe (20 - 100 m) |
3 |
Medium Ice Floe (100 - 500 m) |
4 |
Big Ice Floe (500 m - 2 km) |
5 |
Vast Ice Floe (2 - 10 km) |
6 |
Giant Ice Floe (> 10 km) |
7 |
Fast Ice |
8 |
Ice of Land Origin |
9 |
Undetermined or Unknown |
/ |
U.S. National Ice Center |
|
Fa, Fb, and Fc represent the predominant form of ice (floe size). Table 2 below shows the codes used to express this information. Fa, Fb and Fc correspond to Ca, Cb and Cc. Thus, Ca, Sa, and Fa represent the concentration, stage of development, and floe size of the oldest ice in an area. Within the egg, this is read vertically down the left side.
NIC Products » Regional Ice Analysis » Creating Egg Codes
Let's test your recall and create a couple of eggs.
You may wish to use the code tables for assistance (tables open in a new window):
Table 1. Egg Codes for Stages of Ice Development (Sx Codes)
Table 2. Egg Codes for Forms of Ice (Fx Codes)
Question 1
Which of these eggs accurately depicts the following conditions?
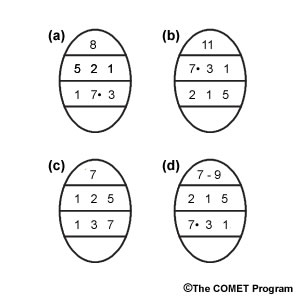
50% new ice (0-10 cm)
20% old ice (>2 m)
10% young ice (10 - 30 cm)
(Choose the best answer.)
The correct answer is Egg (d).
Egg (a) presents the 3 ice types in order of decreasing concentration, not decreasing ice age/thickness.
Egg (b) places stage of formation on the second line and concentration on the third line, rather than the other way around. Also, the number in the top line is the total ice concentration in tenths. This number can never exceed 10.
Egg (c) has several problems: the top line does not represent the sum of the 3 numbers below it, the next two lines are listed in increasing order, the concentrations do not correlate with the ice ages, and the seven should have a dot associated with it (though doing so would imply that numbers to the left would also have a dot associated with them).
Only egg (d) presents the stage information in decreasing order, on the correct line, properly correlated with the ice concentration.
Question 2
Which of these eggs accurately depicts the following conditions?
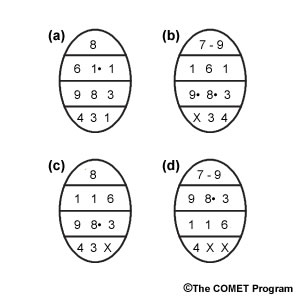
60% Young ice
10% Multi-year ice in medium floes
10% Second-year ice in small floes
(Choose the best answer.)
The correct answer is Egg (c).
Egg (a) presents the concentration code (second line) in decreasing order, not properly correlated with the stage data. The stage data (third line) lacks a dot for the "8". The form data (bottom line) has a 1 for new ice, rather than an "X".
In egg (b) the concentration data does not correlate with the stage data. The stage data has 2 numbers with dots. Only the "8" should have a dot (the right-most number of those that should have a dot). The form data is not in the proper order and does not correlate with the appropriate stage.
Egg (c) is correct.
Egg (d) reverses the second and third lines. In the 4th line, there can only be a single "X" because it is only used for new ice.
NIC Products » Regional Ice Analysis » Interpreting Egg Codes
Examine the egg code shown in the image below and answer the following questions. Refer to
Table 1. Egg Codes for Stages of Ice Development (Sx Codes)
Table 2. Egg Codes for Forms of Ice (Fx Codes).

Question 1
What is the ice concentration of thin first-year ice? (Choose the best answer.)
The correct answer is (d).
The code for thin first-year ice is 7. This is signified in the 3rd line within the egg. The 7 in the line immediately above that designates the concentration. Thus, 70% of the sea is covered by thin first year ice.
Question 2
What ice types cover 10% of the sea surface? (Choose all that apply.)
The correct answers are (c) Young Ice and (l) Old Ice (7•).
Question 3
Examine this egg code. What is the ice concentration of thin first-year ice? (Choose the best answer.)

The correct answer is (a) 0%.
This was a trick question. The 7 in this egg code actually represents old ice (7•). In each egg there is only one dot (7•) and it is shown the thinnest/youngest dotted code. All older/thicker ice that appears to the left is not given the dot. Thus, old ice covers 50% of the surface and there is no thin first-year ice.
NIC Products » Regional Ice Analysis » Applying Egg Codes – Baffin Bay
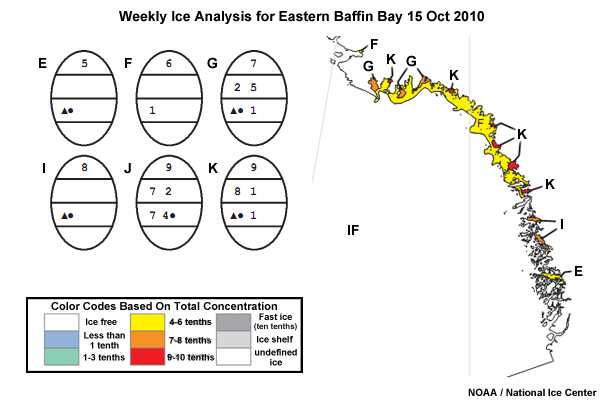
This figure shows an ice analysis for the east coast of Greenland in Baffin Bay, 15 October 2010.
Question 1
What is the difference between zone E and zone I? (Enter your response and click Done.)
Answer:
Both zones are coastal areas, probably fjords with just icebergs present. Zone E has 50% coverage while zone I has 80% coverage.
Question 2
What is the difference between zone I and zone K? (Enter your response and click Done.)
Answer:
Both areas show 80% coverage with icebergs. However, in zone K, new ice has started to form.
Question 3
What is the difference between zone F and zone G? (Enter your response and click Done.)
Answer:
In both areas, most of the ice coverage is new ice: 60% in zone F and 50% in zone G. However, zone G, located close to the coast, also has 20% icebergs.
NIC Products » Regional Ice Analysis » Applying Egg Codes – Ross Sea, Antarctica
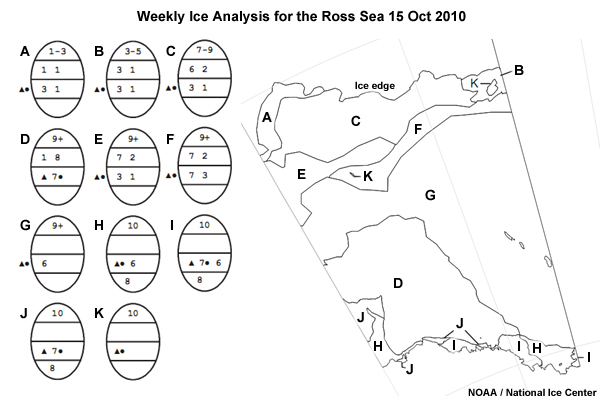
This ice analysis chart and the associated egg codes come from the Ross Sea off of Antarctica (15 Oct 2010). Land lies to the south at the bottom of the map. Ice-free ocean lies to the north of the ice edge.
Question 1
Using Table 1 and Table 2, what best describes the ice in zone C on the map? (Choose the best answer.)
The correct answer is (b).
In the top of the egg, 7-9 represents the total ice concentration of 70-90%. In the compartment below, 6 and 2 represent 60% and 20% coverage. The compartment below that gives the respective thicknesses of young ice (3) and new ice (1). Reading vertically, we get 60% young ice and 20% new ice. The ![]() to the left means that there are also icebergs present in a trace amount.
to the left means that there are also icebergs present in a trace amount.
Question 2
What sea ice lies in zones labelled K? (Choose the best answer.)
The correct answer is (b).
Overall coverage is 10, so the sea is 100% ice covered. The only stage of development is iceberg, signified by the ![]() . From this we can infer a large iceberg.
. From this we can infer a large iceberg.
NIC Products » Special Support Products
If NIC daily or regional ice products don't meet our customers' needs, the NIC can provide specialized support to our customers. This support includes but is not limited to the Fractures, Leads, and Polynyas (FLAP) product, Climatology Briefs/Outlooks, and Annotated Imagery Products.
NIC Products » Special Support Products » FLAP
| Sample FLAP Product |
|---|
| OTTUZYUW RULSHAC0001 1801501-UUUU-RHMCSUU RULSHAC ZNR UUUU FM NAVICECEN SUITLAND MD//NIC// TO USS SUBMARINE INFO COMSUBLANT NORFOLK VA COMSUBPAC PEARL HARBOR HI COMSUBPAC DET ASL SAN DIEGO CA CTF 69 U N C L A S S I F I E D BT MSGID/NAVICECEN/OVLY2/004/JUL OVLY/FLAP1/131501Z/JUL/1OF1/FLAP/METOC LINE/25/0/G/703717N5/1610234W7/703730N0/1610654W3/704131N6 /1614248W6/703557N7/1620507W1/704227N2/1631109W1/704405N0 /1643912W6/702939N0/1650927W0/703826N6/1660846W1/705136N2 /1653923W9/705521N0/1644923W9/705721N2/1653548W2/710347N2 /1671738W3/704639N9/1674211W2/695200N2/1683701W6/694001N0 /1695706W4/700458N4/1713501W8/694956N9/1721800W9/693051N4 /1723223W0/693354N0/1730600W7/685326N0/1725755W2/682016N3 /1725119W6/675804N0/1724041W9/673404N4/1705550W3/665225N6 /1692054W7/662153N3/1683142W5 ARMKS/ICE EDGE LINE/25/0/G/703717N5/1610234W7/703730N0/1610654W3/704131N6 /1614248W6/703557N7/1620507W1/704227N2/1631109W1/704405N0 /1643912W6/702939N0/1650927W0/703826N6/1660846W1/705136N2 /1653923W9/705521N0/1644923W9/705721N2/1653548W2/710347N2 /1671738W3/704639N9/1674211W2/695200N2/1683701W6/694001N0 /1695706W4/700458N4/1713501W8/694956N9/1721800W9/693051N4 /1723223W0/693354N0/1730600W7/685326N0/1725755W2/682016N3 /1725119W6/675804N0/1724041W9/673404N4/1705550W3/665225N6 /1692054W7/662153N3/1683142W5 ARMKS/NRMS FRACTURES1 VARIOUS DIR LINE/13/0/G/684954N6/1653246W7/684954N6/1653246W7/691940N9 /1650741W4/695217N0/1662821W6/692611N5/1670801W3/691651N8 /1680437W9/684801N7/1672317W7/683321N3/1675843W4/681505N5 /1674452W9/675900N7/1661956W4/674808N3/1655112W1/675208N8 /1653856W4/680644N8/1654342W5/ ARMKS/NRMS FRACTURES2 VARIOUS DIR LINE/13/0/G/684954N6/1653246W7/684954N6/1653246W7/691940N9 /1650741W4/695217N0/1662821W6/692611N5/1670801W3/691651N8 /1680437W9/684801N7/1672317W7/683321N3/1675843W4/681505N5 /1674452W9/675900N7/1661956W4/674808N3/1655112W1/675208N8 /1653856W4/680644N8/1654342W5/ ARMKS/POLYNYA1 RMKS/1. LINES ENDING IN TP INDICATE TRANSVERSE POLAR PROJECTION. RMKS/2. THIS MESSAGE IS FOR EXAMPLE PURPOSES ONLY. RMKS/3. LAT LONG PTS RANDOMLY SELECTED. ADDITIONAL INFO WOULD BE ADDED TO THIS SECTION. ENDAT// BT #010 NNNN |
| U.S. National Ice Center |
The FLAP is a text message with the latitude and longitude points of areas within the ice pack that contain fractures, leads, and polynyas (FLAP). FLAP support is generally used by the U.S. Navy.
NIC Products » Special Support Products » Climatology Briefs/Outlooks
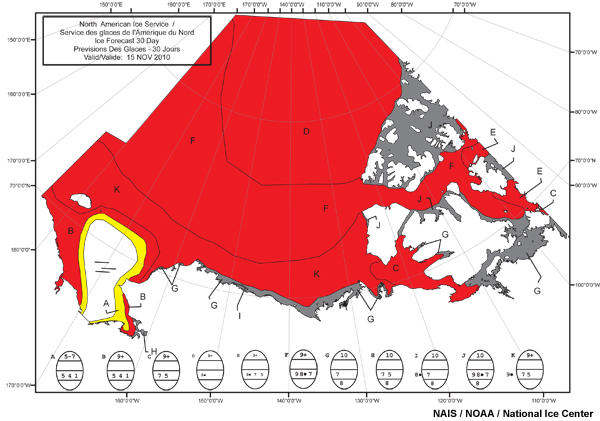
NIC Climatology briefs/outlooks are produced for specific areas in the Arctic or Antarctic. NIC staff examine current-year ice conditions, find climatological records with analogous conditions, and match that information with forecast meteorological conditions. The climatology briefs are used by multiple agencies within the Department of Defense, Department of Commerce, and Department of Homeland Security.
This image shows a 30-day forecast of ice conditions in the western Arctic north of Canada and Alaska.
NIC Products » Special Support Products » Annotated Imagery

Annotated imagery support is generally for ships operating in and around the ice. The NIC takes the raw satellite imagery and annotates that imagery with information regarding the ice conditions to include ice concentration and ice type.
NIC Products » Special Support Products » Requesting Support
Requests for tailored or special support can be submitted via the NIC webpage at www.natice.noaa.gov There is a link to the request form under the Special Support tab. Additionally, requests can be made via message traffic or by contacting the Operations Floor by telephone using the number on the NIC website homepage (202-761-1401).
The NIC CDO can be contacted 24 hours a day by phone or e-mail using contact information on the NIC contact page (http://www.natice.noaa.gov/contact_us.html)
Text Note:
Current phone number (2011): 301-943-6977.
Current email address: liaison_web@natice.noaa.gov
NIC Products » Ship Synoptic Codes
The other place to get information on sea ice is in synoptic observations from ships operating in or near ice. The WMO has a format for encoding these sea ice observations within the synoptic code. Here we examine how to encode and read the ice code.
Here is the format for encoding synoptic observations from ships.
Section 0 |
BBXX DDDD YYGGiw 99LaLaLa QcLoLoLoLo |
Section 1 |
iRiwhVV Nddff (00fff) 1snTTT 2snTdTdTd 4PPPP 5appp 7wwW1W2 8NhCLCMCH 9GGgg |
Section 2 |
222Dsvs 0SsTwTwTw 2PwPwHwHw 3dw1dw1dw2dw2 4Pw1Pw1Hw1Hw1 5Pw2Pw2Hw2Hw2 |
| NOAA / NWS | |
Section 0 contains identification information.
Section 1 contains meteorological information.
Section 2 contains oceanographic data, including sea ice data. Note the highlighted text:
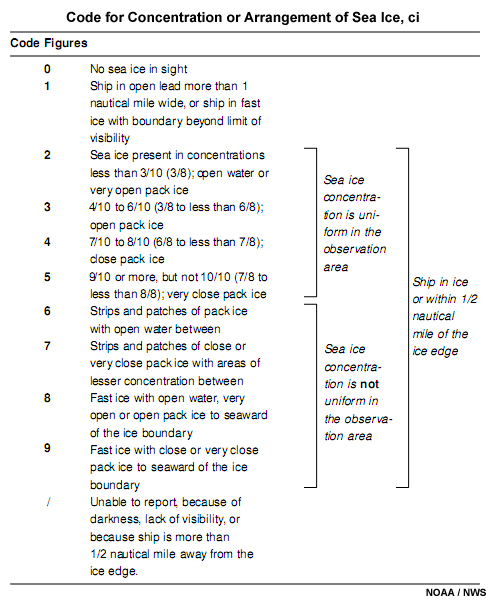
ICE ciSibiDizi or ICE + plain language
| Field | Definition |
|---|---|
ci |
Concentration or arrangement of sea ice |
Si |
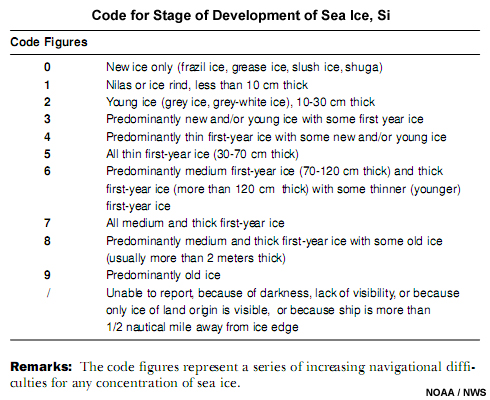
Stage of development of sea ice |
bi |
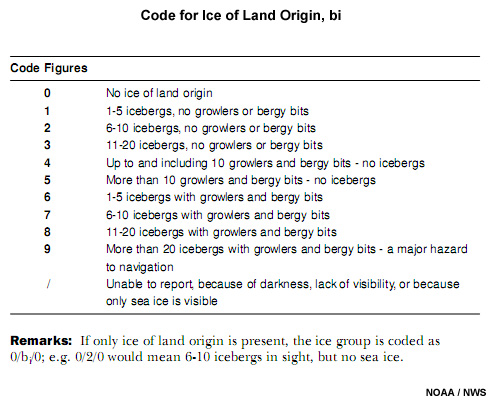
Ice of land origin (i.e., icebergs) |
Di |
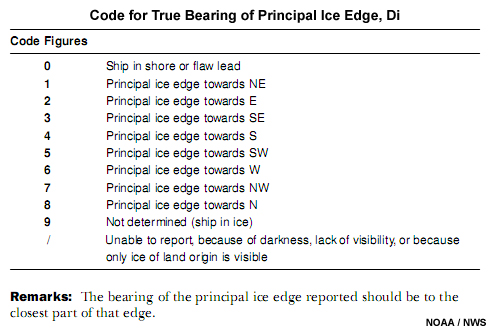
True bearing of principal sea ice edge |
zi |
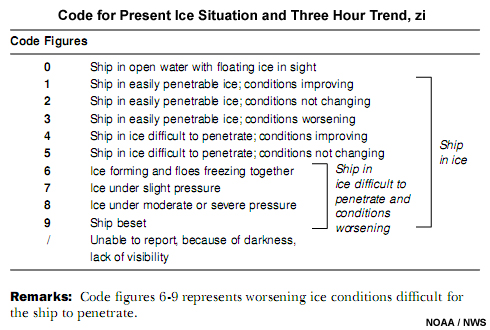
Present sea ice situation and trend of conditions over preceding three hours |
| NOAA / NWS | |
Source: National Weather Service Observing Handbook No. 1: Marine Surface Weather Observations
NIC Products » Ship Synoptic Codes » Questions
Remember, the ICE code format is like ICE ciSibiDizi. Table 3, Ice Codes, (click to open an another window) provides the values for the questions below.
Question 1
Write the ice code for these conditions:
50% coverage of the sea by grey ice.
20% coverage by nilas.
3 icebergs visible.
Conditions have been steadily worsening.
(Enter your response and click Done.)
The correct answer is "ICE 42193".
Using the code "ICE cSbDz"
c = Concentration
Observation: 50% + 20% = 70%
Code = 4 (7/10 to 8/10, closed pack ice)
S = Stage
Observation: Grey ice
Code: 2 (Young ice [grey ice, grey-white ice, 10-30cm thick])
b = Ice of land origin (icebergs)
Observation: 3 icebergs visible
Code: 1 (1-5 icebergs, no growlers or bergy bits)
D = Bearing of principal ice edge
Code: 9 (Not determined. Ship in ice.)
z = Present ice situation and trend of conditions over preceding 3 hours
Observation: Conditions have been steadily worsening
Code: 3 (Ship in easily penetrable ice; conditions worsening)
Question 2
Interpret the following synoptic ice code.
ICE 56094
(Enter your response and click Done.)
Answer:
Uniform ice concentration of 90-100%
Medium (70-120 cm) and thick (>120 cm) first-year ice
No icebergs in sight
Ship in ice
Ship in ice difficult to penetrate, conditions improving.
Detecting Ice
Click to play animation.
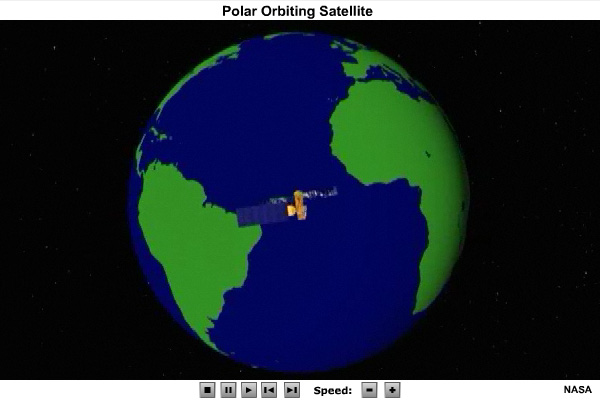
How does the National Ice Center create their analyses? The Arctic and Antarctic are vast areas with few observing stations. As a result, NIC must rely on remote sensing from satellites. And because imagery from geostationary satellites is problematic at high latitudes, remote sensing data used by NIC come from polar-orbiting satellites. These satellites fly over the same place at the same time twice each day.
The National Ice Center uses 4 types of imagery to analyze sea ice.
- Visible
- Infrared
- Passive Microwave
- Synthetic Aperture Radar (SAR)
Detecting Ice » Visible Imagery
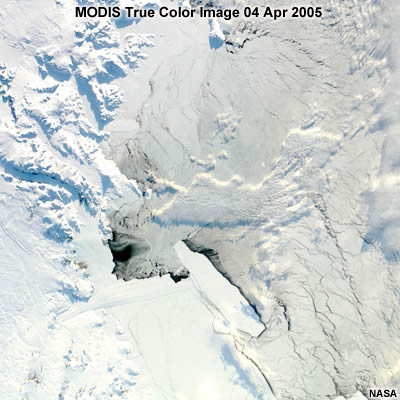
Visible imagery for sea ice analysis comes from sensors aboard several satellites: MODIS, AVHRR, and DMSP-OLS. These sensors all offer twice-per-day coverage, more frequent in the high Arctic.
Visible images are great for analyzing sea ice, but visibility depends on daylight and weather. Unfortunately, sea ice is more extensive when darkness prevails during the long polar winter. Furthermore, ice-covered polar regions tend to be cloudy, with clouds obscuring sea ice 70 to 90 percent of the time.
When visibility is good, detection of fast ice is good, but detection of new ice is poor compared to SAR. Visible imagery can also be used to compute sea ice concentration and ice edge location. And a sequence of images can be used to compute ice motion.
Resolution of visible images varies widely. It ranges from 250 meters for the MODIS instrument to 550 meters for DMSP-OLS sensors to 1000 meters for AVHRR.
| Sensor | Resolution | Swath width |
|---|---|---|
NASA MODIS (Moderate Resolution Imaging Spectroradiometer) |
250m (0.25km) |
2300 km |
DMSP OLS (Defense Meteorological Satellites Program-Operational Linescan System) |
550m (0.55 km) |
3000 km |
NOAA AVHRR (Advanced Very High Resolution Radiometer) |
1000m (1km) |
2400 km |
| NASA / NOAA | ||
Detecting Ice » Infrared Imagery
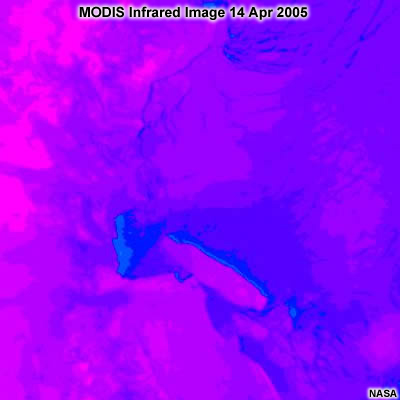
Infrared images are obtained from the same instruments as the visible images: MODIS, DMSP-OLS, and AVHRR. While infrared images are still subject to weather, they can be obtained at night, which makes them useful during the long polar night.
Infrared sensors can easily detect sea ice because its temperature is generally much colder than the surrounding ocean. A typical winter sea ice temperature is -20 to -40 degrees Celsius (-4 to -40 degrees Fahrenheit), while the surrounding ocean temperature is above freezing. However, during the summer, the surface temperature of sea ice increases to the freezing point. Melting sea ice is difficult to distinguish from surrounding ocean that is only slightly warmer.
| Sensor | Resolution | Swath width |
|---|---|---|
MODIS |
1000m (0.25km) |
2300 km |
DMSP OLS |
550m (0.55 km) |
3000 km |
AVHRR |
1000m (1km) |
2400 km |
| NASA / NOAA | ||
Detecting Ice » Passive Microwave
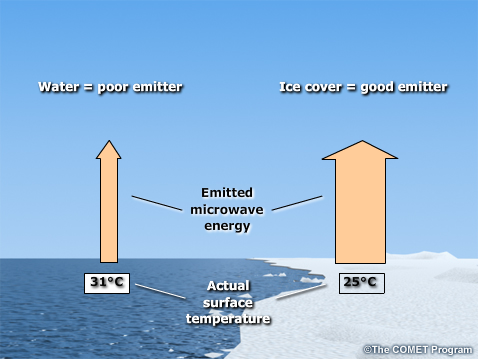
Objects at the earth's surface emit not only infrared radiation; they also emit microwaves at relatively low energy levels. When a sensor detects microwave radiation naturally emitted by the earth, it is called passive microwave radiation. Microwaves penetrate clouds and thus can be used to detect sea ice during the day and night, regardless of cloud cover.
An object's physical properties, such as atomic composition and crystalline structure, determine the amount of microwave radiation it emits. The crystalline structure of ice typically emits more microwave energy than the liquid water in the ocean. Thus, sensors that detect passive microwave radiation can easily distinguish sea ice from ocean.
With this information we compute sea ice concentration.
Because the energy level of passive microwave radiation is quite low, the radiation must be collected over a larger region, which results in relatively low-resolution images. Consequently, passive microwave sensors will not detect details of the sea ice, such as leads and icebergs.
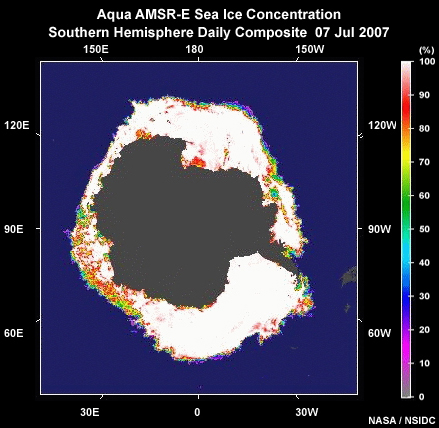
Several instruments provide passive microwave data at different resolutions, including AMSU, AMSR-E, SSM/I, and SSMIS.
| Sensor | Resolution | Swath width |
|---|---|---|
AMSU |
45-120 km |
1650 km |
AMSR-E |
12.5 & 25 km |
1445 km |
SSM/I & SSMIS |
25 km |
1700 km |
| NASA / NOAA | ||
Detecting Ice » SAR
In addition to passively sensing emissions coming from objects on Earth, satellite sensors can also actively emit microwaves toward the earth's surface and then measure the reflected microwaves that return. We call this type of remote sensing active microwave, or radar. Like passive microwave sensing, active microwave can be used to detect sea ice during the day and night, regardless of cloud cover.
As with passive microwave energy, the physical properties of the earth's surface determine the amount and characteristics of microwave radiation reflected back to the sensor. Sea ice typically reflects more of the radar energy emitted by the sensor than the surrounding ocean, which makes it easy to distinguish between the two. Furthermore, thicker multi-year ice reflects more microwaves than younger, thinner ice.
For high-resolution imaging of sea ice, we use an instrument called synthetic aperture radar (SAR). SAR can not only measure the extent of thick vs. thin sea ice. It can even detect small leads in sea ice. This fine resolution allows analysts to help route ships through ice-covered regions. Thus, SAR imagery is particularly valuable for the National Ice Center and other operational ice centers.
SAR data is not without weaknesses, however. Like passive microwave sensing, melt ponds in the summer tend to obscure the sea ice. And SAR does a poor job detecting fast ice.
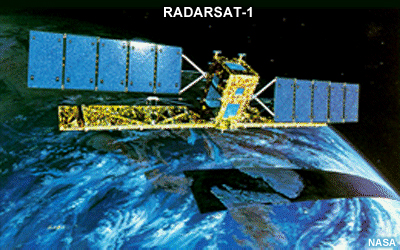
Several instruments provide SAR data to ice centers, including RADARSAT-2, PALSAR, and ENVISAT- ASAR. Compared to other remote sensing data, SAR data has a narrow swath and lengthy processing. This makes the data expensive and means that it must be ordered in advance.
| Sensor | Resolution | Swath width |
|---|---|---|
RADARSAT-2 |
3-100 m |
up to 500 km |
PALSAR |
7-100 m |
up to 350 km |
ENVISAT-ASAR |
30-150 m |
up to 400 km |
| NASA / NOAA | ||
Detecting Ice » Questions
Question
If you cannot see an iceberg on visible imagery, the area is ice free. (Choose the best answer.)
The correct answer is (b) False.
While the large icebergs shed from Antarctica that measure 10's of kilometers across will be detected by many visible sensors, smaller icebergs shed from Greenland most likely will not. Only SAR, with a resolution of 100 meters or less, has adequate detail to show many smaller icebergs.
Detecting Ice » Analyzing Images
Detecting Ice » Analyzing Images » Ice Concentration
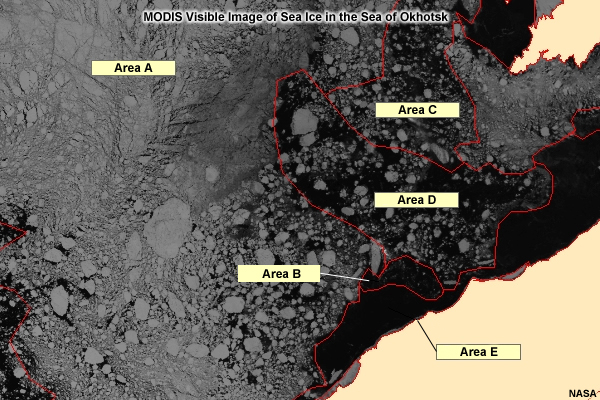
Question
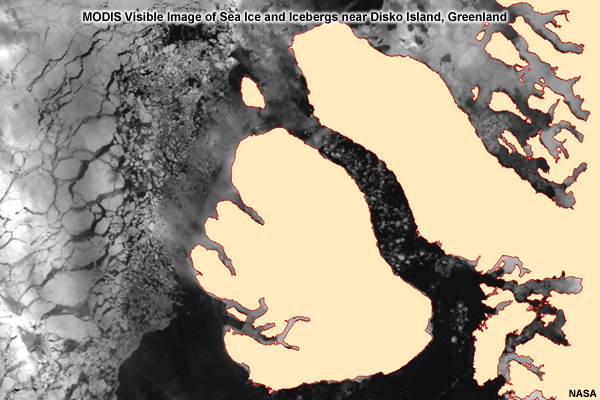
Suppose that you are an ice analyst. Using the dropdown boxes, estimate the ice concentration in each region outlined in this MODIS visible image, then click Done.
Compare your answers to those obtained by an analyst at the National Ice Center in the image below.
Detecting Ice » Analyzing Images » Icebergs
Question
Study the image above to determine the area where icebergs exist. When you've made your determination, click Done to compare your answer with those obtained by an analyst at the National Ice Center.
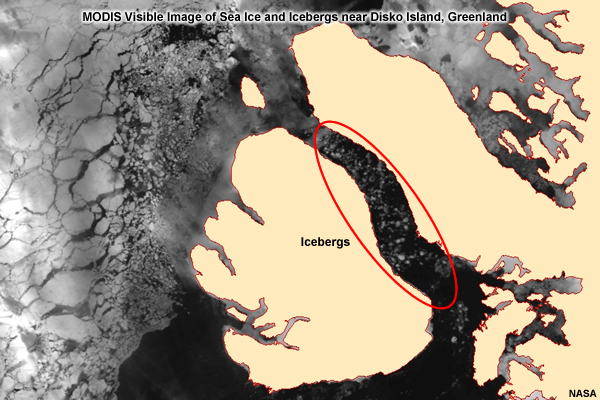
Note that the icebergs appear in a channel with several fjords located immediately to the east.
Detecting Ice » Analyzing Images » Ice Edge, Marginal Ice Zone, and Pack Ice
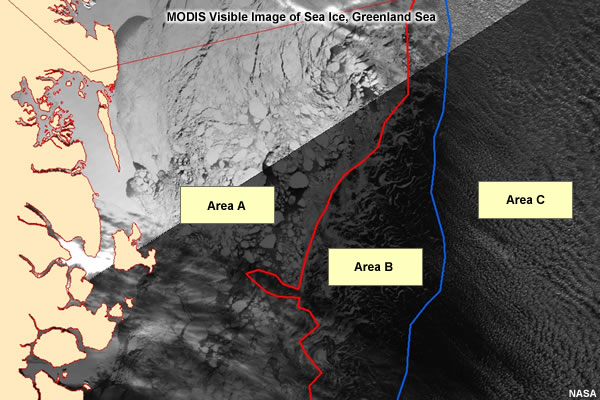
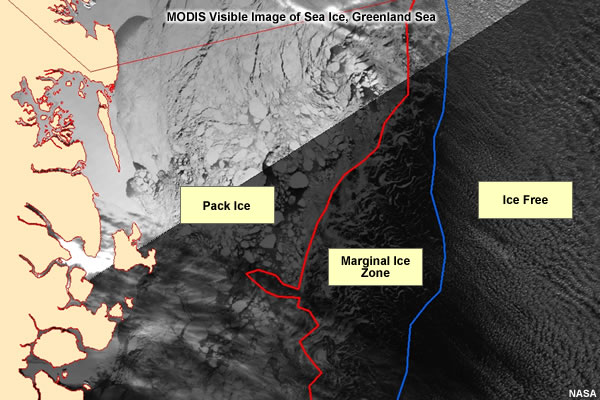
Question
Use the dropdown boxes to match the description fields on this MODIS visible image to their labels, then click Done.
Compare your responses to those from the analyst at the National Ice Center. Note the different appearance of clouds on the right side of the image and drifting ice in the marginal ice zone.
Detecting Ice » Analyzing Images » Fast ice vs. Young Ice
Now let's look at different types of ice as seen in different types of images. We will use high resolution images from RADARSAT SAR images and MODIS visible images.
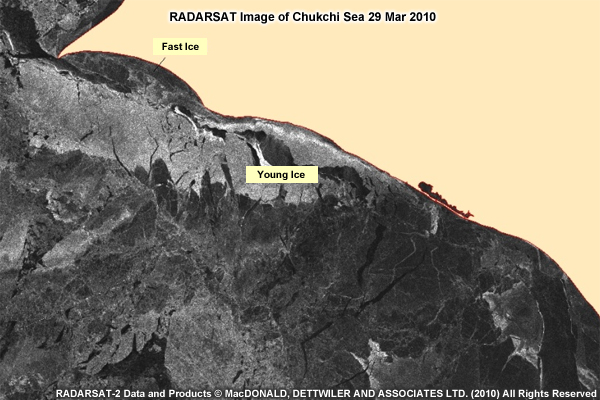
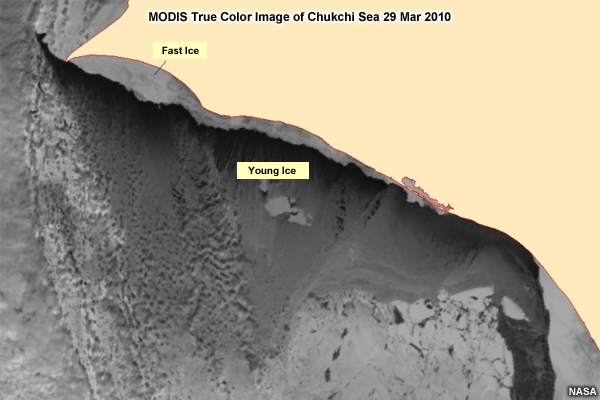
Toggle these images (in the tabs above) between the visible and SAR images and then answer the following two questions.
Question 1
Which image shows the fast ice more distinctly? (Choose the best answer.)
The correct answer is a), MODIS visible image.
On the visible image, the fast ice stands in stark contrast to the adjacent young ice.
Question 2
Which image shows young ice more distinctly? (Choose the best answer.)
The correct answer is b), RADARSAT SAR image.
On the SAR image, young ice appears quite different from other areas of ice.
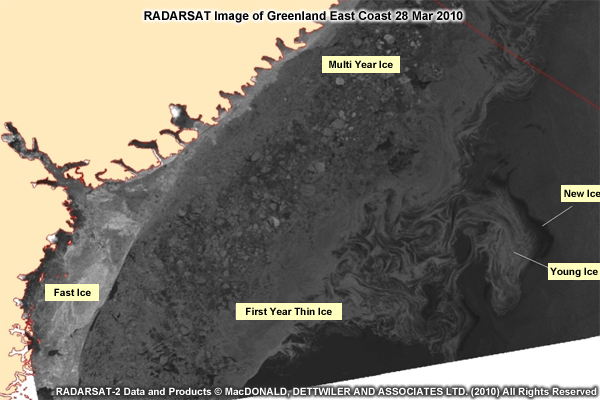
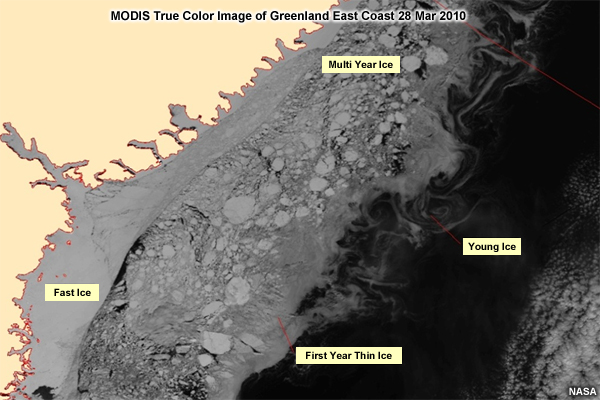
Detecting Ice » Analyzing Images » Multiyear, First Year, Young, and New Ice
Toggle these images toggle between the visible and SAR images.
Question 1
Which image does a better job depicting new and young ice? (Choose the best answer.)
The correct answer is b), RADARSAT SAR image.
The SAR image appears to depict a great deal more young ice than the visible image. And the visible image appears to completely miss the new ice. Also notice that the clouds visible in the visible image do not appear in the SAR image.
Question 2
Which image shows multiyear ice more distinctly? (Choose the best answer.)
The correct answer is c), neither - both images depict multiyear ice equally well.
Both images appear to depict the large floes of multiyear ice. An ice analyst could use either image to separate multiyear ice from either the first year thin ice or the fast ice close to shore. However, SAR images, depending on the wavelength used, allow the detection of the hummocky ridges on multi-year ice. This could enhance the distinction between multi-year ice and first-year ice.
Summary
Ice presents a constant danger for ships operating in the Arctic. Ships can sustain damage from collisions or become trapped and unable to move (beset). There are 2 kinds of ice floating in the Arctic: sea ice and icebergs. They differ in the way they form and the danger they present.
Sea ice forms when seawater freezes. As one might expect, sea ice forms in winter, reaching a maximum in late winter, and melts in summer, reaching a minimum in late summer. In recent years, the thickness and extent of sea ice has been decreasing. This has opened up sea routes across the Arctic in the summer. Long-term climate models indicate ice-free summers by the end of this century.
Sea ice is classified by its thickness and age. It ranges from a soupy mix of crystals to multi-year ice up to 3 meters thick. When sea ice forms, ice crystals expel salt, which accumulates in pockets of salty brine. These pockets weaken the newly formed ice. Over time the brine escapes and is replaced with summer meltwater, which freezes the following winter. The resulting multi-year ice is much stronger and presents a formidable barrier to icebreakers.
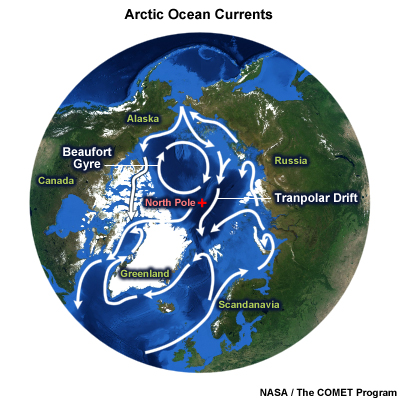
With the exception of fast ice, which is fastened to the shore or seafloor, sea ice is in constant motion. Over short time periods, wind is the primary driver. Over longer periods of time, ice tends to follow the major currents, including the Beaufort Gyre and Transpolar Drift.
One consequence of this motion is that open water can be found year-round. Areas of open water are called fractures, leads, or polynyas depending on their size and shape. They are important both operationally as well as ecologically.
Analyses and forecasts for sea ice are available online from the National Ice Center. These products include a daily ice edge, weekly ice analyses, 30-day outlooks, and more.
Sea ice analyses depend on satellite remote sensing. Satellite products include visible, infrared, and microwave images. Each type of imagery has respective strengths and weaknesses.
Icebergs form when ice calves off glaciers into sea. As a result the ice is very fresh and thus very strong. Also, because the ice accumulates on land, icebergs can be much thicker than sea ice.
Icebergs are classified by size and shape. Sizes can range from small bergy bits to hundreds of square kilometers. While Arctic icebergs do not reach the size of their Antarctic cousins, they can still present a formidable hazard.
Most Arctic icebergs form around Greenland (but can be present in many of the Arctic Seas). They are carried by currents that follow the coast of Greenland and Baffin Bay, then down past Labrador and Newfoundland and into North Atlantic shipping lanes.
Because icebergs present such a danger, they are closely monitored by the International Ice Patrol, which produces a daily chart showing their occurrence.
Click here for a printable, take-away summary in .pdf format.