
How to Read the Model Results
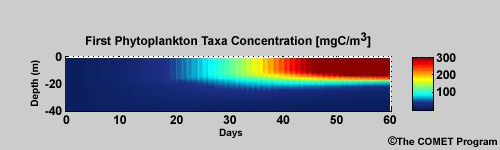
The model results are presented as a series of time-depth cross-sections, one for each model component. This plot shows one such cross section for phytoplankton abundance. The vertical axis is the depth. The horizontal axis shows the time. The abundance or concentration of the particular component is shown with color, in this case milligrams of carbon per cubic meter of seawater. Different color scales are available through the model interface.