Encoding Section 2 Synoptic Observations
Section 2, Group 222 and Group 0
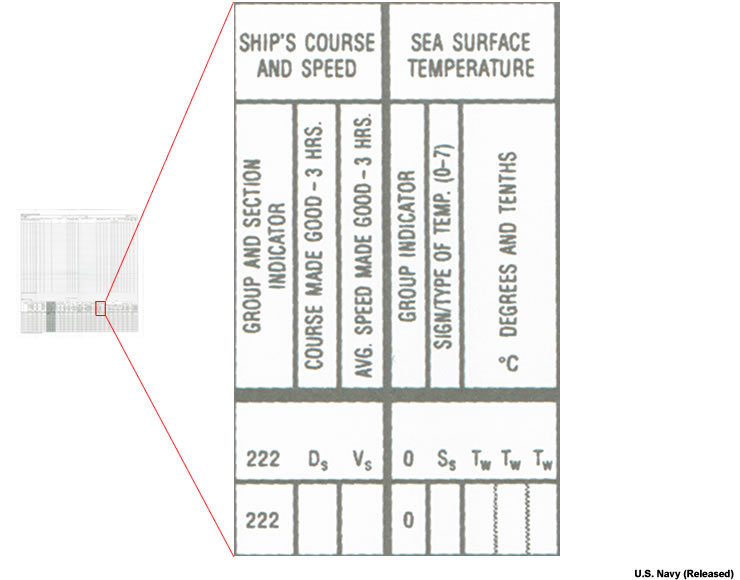
Group 222 contains fields for reporting the ship's course. Sea surface temperature information is reported in Group 0.
The parameters are reported as follows:
Section 2, Group 222
- Ship's course, Ds
Ds is the ship's course (or direction) made good, for the previous 3 hrs. - Ship's speed, Vs
Vs is the ship's average speed made good, for the previous 3 hrs.
Section 2, Group 0
Sea surface temperature data are reported in Group 0 as follows:
- Sea surface temperature, 0sSTwTwTw
OsSTwTwTw is sea water temperature with sign (code 0-7) and sea water temperature in tens, units, and tenths degrees Celsius
Section 2, Groups 2, 3, 4, and 5
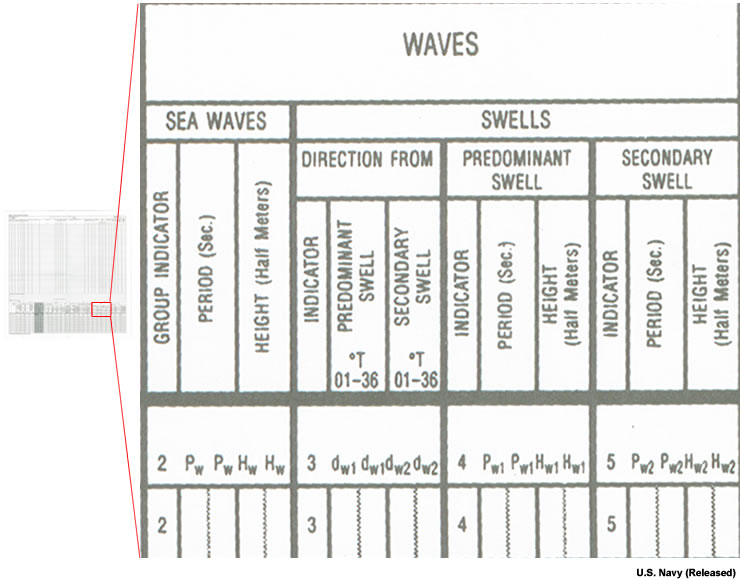
Sea wave (also called wind wave) and swell wave data are reported in Section 2, Groups 2, 3, 4, and 5.
The values to be reported are as follows:
Section 2, Group 2
- Sea wave period, PwPw
PwPw is the average period of significant wind waves in seconds (example, enter 3 seconds as 03, calm seas as 00, confused seas as 99). - Sea wave height, HwHw
HwHw is the code figure indicating height of wind waves adjusted to half meters (see Table III-4-4). So a wave height of 5 ft is encoded as 03 from the Table III-4-4.
Section 2, Group 3
- Predominant swell direction, dw1dw1
dw1dw1 is the primary swell wave direction encoded in hundreds and tens of degrees (example, 240 or 090). If the element is not observed, enter 3000. - Secondary swell direction, dw2dw2
dw2dw2 is the secondary swell wave direction in hundreds and tens of degrees. In most cases, only one swell will be present and you will enter “00”.
Section 2, Group 4
- Predominant swell period, Pw1Pw1
Pw1Pw1 is the average period of primary swell wave in seconds (09 for 9 seconds, etc.) - Predominant swell height, Hw1Hw1
Hw1Hw1 is the height of primary swell waves in half meters based on Table III-4-4.
Section 2, Group 5
- Secondary swell period, Pw2Pw2
Pw2Pw2 is the average period of secondary swell wave in seconds. Secondary swell occurs rarely. If it is not observed, enter 50000. - Secondary swell height, Hw2Hw2
Hw2Hw2 is the height of secondary swell waves in half meters (see Table III-4-4). This value is only reported if secondary swell is observed.
Note that all wave heights are encoded in half meters in the Synoptic code. You must use the conversion Table III-4-4 for the correct code. The wave heights are not encoded in feet.
Section 2, Group 6, 8, ICE
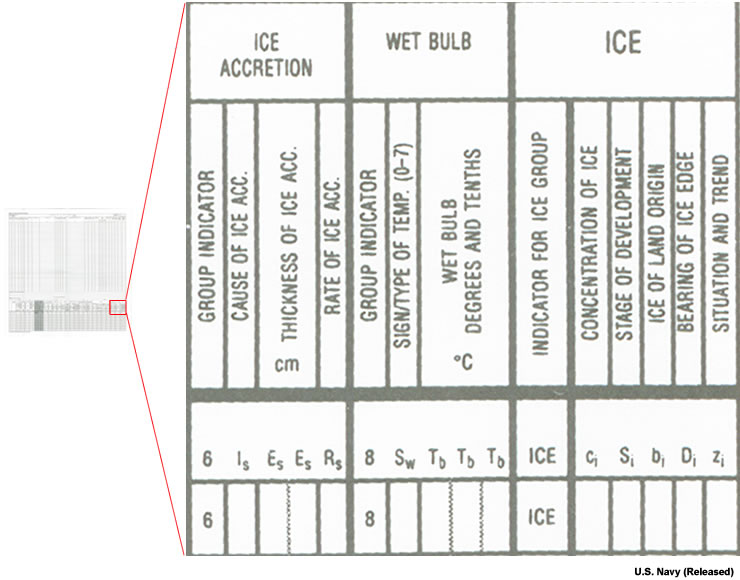
Ice accretion information is encoded in Section 2, Group 6 on the observing form. Group 8 contains fields for reporting the wet bulb temperature. Sea ice observations, including sea ice concentration and state of development, are encoded in Group ICE. Land origin ice is also reported in this group.
The values reported include the following:
Section 2, Group 6
- Cause of ice accretion, Is
Is is the source of ice accretion (Table III-4-5). Example: If clear ice is forming due to blowing spray, encode Is as 1 based on Table III-4-5. - Thickness of ice accretion, EsEs
EsEs is average thickness of ice in centimeters (Table III-4-6). Example: If a half inch of ice is covering the ships rails, encode the thickness as 01 based on Table III-4-6. - Rate of ice accretion, Rs
Rs is the rate of buildup or melting of ice accretion (Table III-4-7). Example: If rime ice is melting rapidly off the ships surface, encode Rs as 4 based on Table III-4-7.
Section 2, Group 8
- Wet bulb temperature, SwTbTbTb
encode the Sw is sign and type of web bulb temperature (Table III-4-8); TbTbTb is the wet bulb temperature in tens, units, and tenths degrees Celsius. If you have measured a wet bulb temperature of 9.5 °C, encode SwTbTbTb as 0095 based on Table III-4-8. Note that the code for Sw will be different if you computed (rather than observed) the wet bulb temperature.
Section 2, Group Ice
- Sea ice concentration, ci
Ci is the code figure that best describes the concentration and arrangement of sea ice (Table III-4-9). Example: If there is fast ice near the shore and open water seaward of the ice, encode Ci as 8 based on Table III-4-9. - Stage of development, si. si is the code figure that best describes the development stage of the sea ice (Table III-4-10). Example: If the ice around the ship is first-year ice between 70 and 120 cm thick, encode si as 6 based on Table III-4-10.
- Land origin ice, bi
bi is the code figure that best describes the ice of land origin present (Table III-4-11). If ice is floating around the ship and there are three icebergs but no growlers or bergy bits, encode bi as 1 based on Table III-4-11. - Ice edge bearing, di
di is the code figure that best describes the orientation of the principal edge of the sea ice (Table III-4-12). Example: If the ship is sailing near the edge of a continuous sheet of ice extending to the northwest, encode di as 7 based on Table III-4-12. - Situation and trend, zi
zi is the code figure that best describes the effect of sea ice on the ship over past three hours (Table III-4-13). Example: If the ship has been sailing in open water with some ice floating around it for the last three hours, zi is encoded as 0 based on Table III-4-13. - Plain language = remarks considered significant by the observer.