
Concentration versus Time and Depth
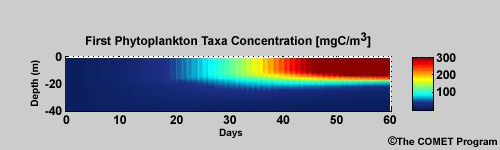
This plot shows a period of explosive population growth of the phytoplankton community, also known as a plankton bloom, in a simple model run with only phytoplankton and nitrogen (not shown).
1 of 2
When is plankton most abundant? (Choose the best answer.)
The correct answer is (c) Day 45.
The abundance of phytoplankton is measured as milligrams of carbon per cubic meter of seawater (mgC/m3). The highest concentrations are shown in dark red. The lowest concentrations are shown in dark blue. The highest concentrations occur near the end of the model run time. Thus (c) Day 50 is the best answer. On day 10, the color is dark blue, indicating a biomass concentration still near zero: the bloom had not yet started. At day 30, the color is a light blue, indicating the concentration is near 100 mgC/m3: the bloom had started, but had not yet reached its peak.
2 of 2
On day 45, at what depth is plankton most abundant? (Choose the best answer.)
The correct answer is (a) 10 m.
On day 45, at 10 m depth, the plot shows a deep red color, indicating a phytoplankton biomass concentration exceeding 300 mgC/m3. At 20 m, there is a sharp decrease in the biomass concentration to values approaching zero. Overall this plot shows a phytoplankton bloom with a rapid rise in phytoplankton biomass from near zero to over 300 mgC/m3 over a 20-day period starting at about day 20. The bloom is confined to the top 20 m of water, and most concentrated in the top 15 m.