
Results as a Series of Vertical Profiles
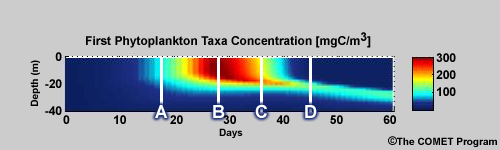
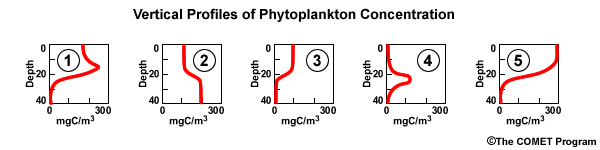
We can also view the time-depth vertical cross section as a chronological series of vertical profiles (i.e., a time series). This plot also shows phytoplankton biomass for a model run with nitrogen, phytoplankton, zooplankton, and detritus as components. The vertical lines on the plot mark the location of vertical profiles.
For each location (A,B,C,D) choose the correct vertical profile (Profile 1 - Profile 5)
1 of 1
(Select the appropriate vertical profile for each location on the map.)
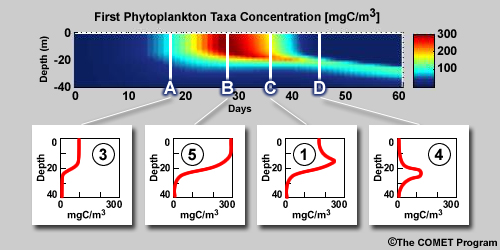
The correct answers are:
- Location A = Profile 3
- Location B = Profile 5
- Location C = Profile 1
- Location D = Profile 4