
K and Growtho: 2 Phytoplankton Taxa
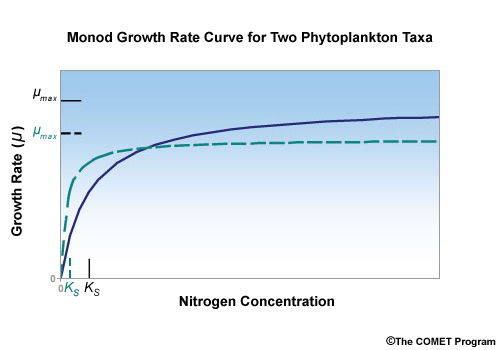
This graph shows the growth rate for two different hypothetical phytoplankton taxa. The taxa represented by the dashed line has a smaller μo (and hence a smaller μmax), as well as a smaller K for nitrogen. Notice that at low nutrient levels, the taxa represented by the dashed line displays a higher growth rate than the other solid-line taxa. However, at higher nutrient levels, the situation is reversed and the solid-line taxa grows more quickly than the dashed-line taxa.