Table of Contents
Aug 04, 2000
Aug 04, 2000 Dutch Harbor
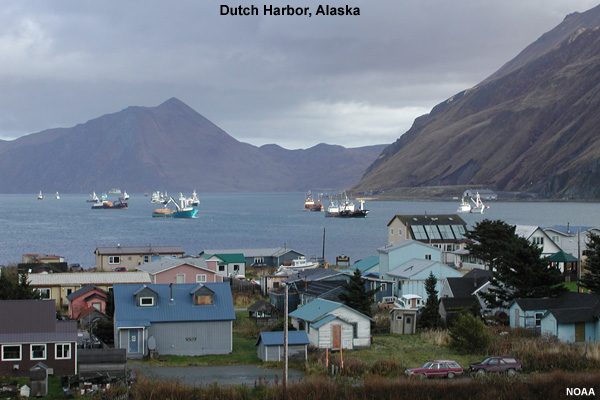
We arrived in Dutch Harbor today after 30 days out in the Bering Sea. Just the normal search-and-rescue and law enforcement operations in support of the commercial fishing fleet.
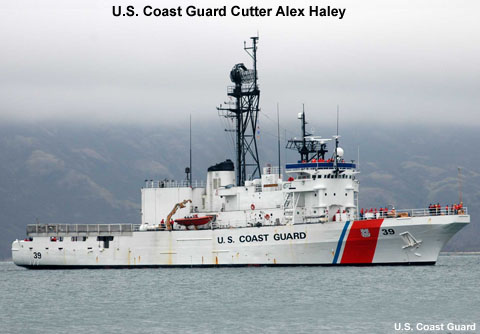
I'm a forecaster aboard the Coast Guard Cutter Alex Haley, a Navy salvage tug converted for patrol purposes in the Bering Sea and Arctic. My task is to provide the Commanding Officer with forecast information as needed.
We're in port to refuel, reprovision, and prepare for departure to the North Slope of Alaska. When I was assigned to the Haley, I wondered what the Coast Guard was doing in the Arctic. Having to give up my summer in San Diego to go to the Arctic, it seemed like I drew the short straw. During my introductory briefing, it was all made clear.
Aug 04, 2000 Limits
When I first arrived on board, the captain detailed the Haley's weather limits.
Wind: 40 kt
Seas: 18 ft (bow/stern)
12-14 ft (beam)
As weather approaches those thresholds the Commanding Officer will consider limiting boat drills and flight operations, and holding up in sheltered waters.
The Captain's concerns are expected sea state and wind for the 72 to 96 hour timeframe. He needs to be especially aware of the weather and any changes to the 24 to 48-hour forecast, as it takes planning to get the ship into an appropriate "safe haven" from the weather.
Aug 04, 2000 Planning
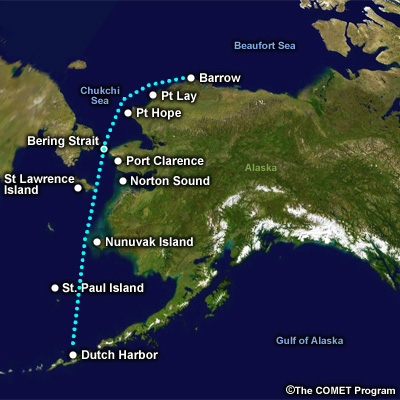
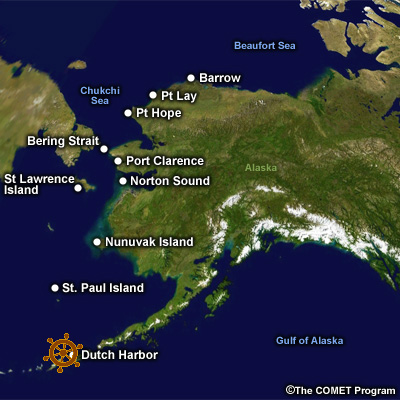
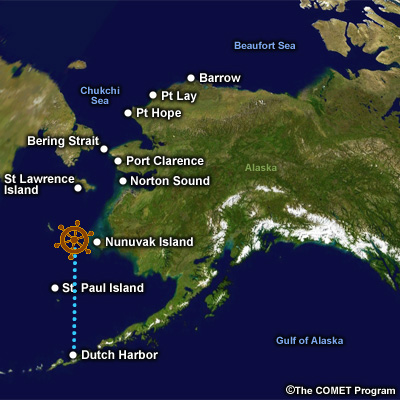
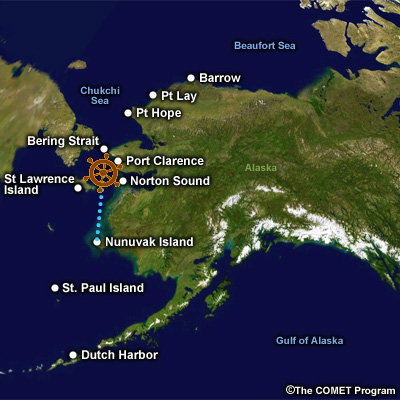
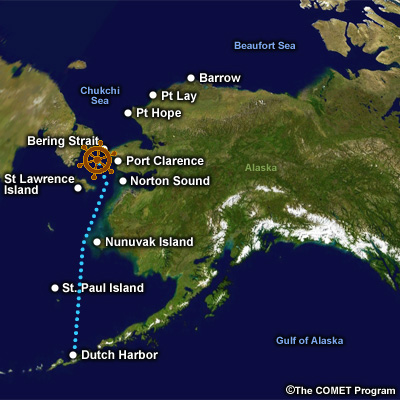
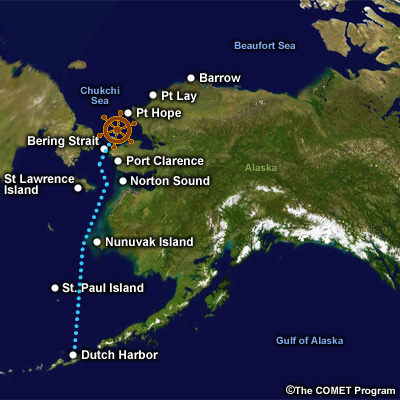
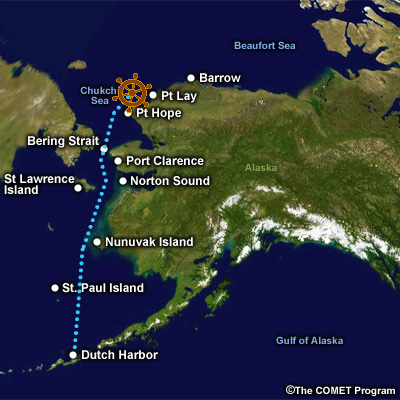
Our passage will take us from Dutch, past Nunivak Island, through the Bering Strait and up to Barrow. The coast of Southwest Alaska offers excellent shelter for ships in transit up to the Bering Strait. There are numerous islands to offer a protection on their lee side and some well established harbors for better shelter if necessary.
North of the Bering Strait is a different story. The coastline is pretty rugged and remote with few adequate harbors. In the event of severe weather the ship must be prepared on short notice. Sailing time to the Bering Strait is expected to take 3 days with 2 more days to Barrow. If conditions will not permit a transit within wind and sea limits, then the Captain will divert into Port Clarence and hold up or remain at sea south of the strait itself.
Since I've never been north of the Arctic Circle, I review the geography of the Arctic while I have the charts and maps handy.
Aug 04, 2000 » Planning Question
Question
Which of the following defines "Arctic"? (Choose the best answer.)
The correct answer is d) "All of the above."
Treeline and the July 10°C isotherm delimit a very similar area. The Arctic Circle at about 66°N is also useful as it marks the southern limit of 24-hour sunlight at the summer solstice and 24-hour darkness at the winter solstice.
Aug 04, 2000 Climatology
The captain has asked for a weather briefing later today. I start preparing by reviewing the climatology.
Aug 04, 2000 » Climatology Question
Question
In which location is the tropopause at a higher elevation? (Choose the best answer.)
The correct answer is b) "Tropics."
Because air is cooler and denser in the Arctic, the tropopause lies at a lower elevation. This restricts the height of storms and limits convection.
Aug 04, 2000 Current Weather
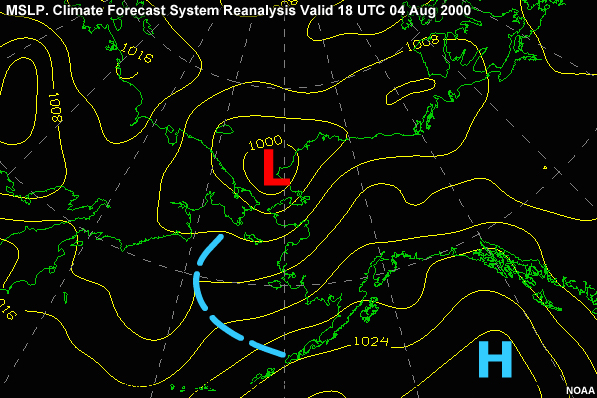
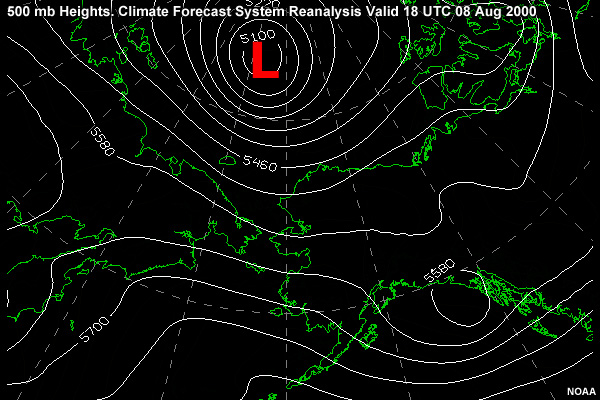
Now I pull the weather charts and study the weather located ahead over our track and off to the west. Looking at the 04/18Z surface chart, we find high pressure located over the North Pacific with a weak ridge of high pressure located over the ship's track. A weakening low pressure system is located over Kotzebue Sound.
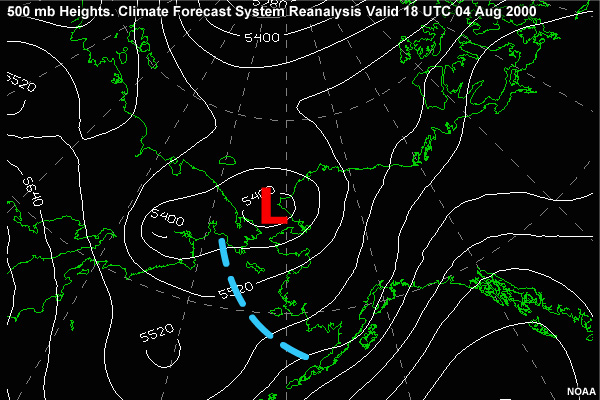
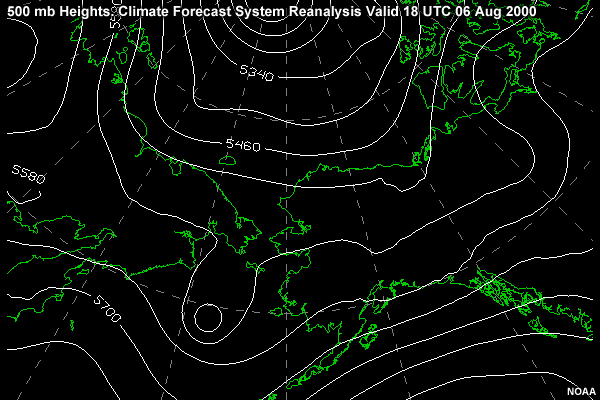
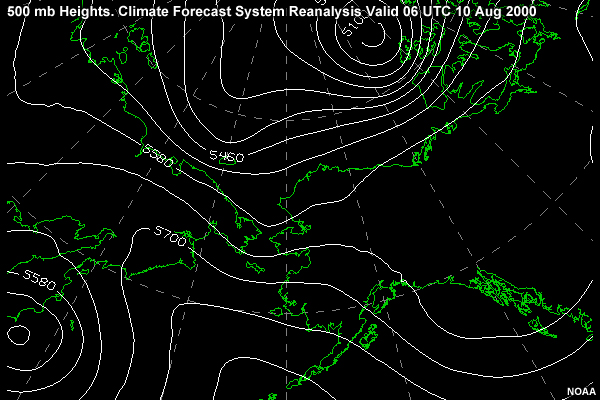
The 500-mb chart shows the ridge over the Gulf of Alaska is vertically stacked with height and thus not moving. The upper level low north of the Nunivak area has height rises as well and is filling. This is reflected on the surface as the low there also fills and drifts north.
I also check the forecasts available from the Naval Maritime Forecast Center in Pearl Harbor and the maritime forecasts from the NWS in Anchorage, Alaska. The following is forecast for the next 48 hours:
Sky: Overcast stratus
Visibility: Unrestricted, temporary 100 ft obscured
Wx: Intermittent Drizzle & Fog
Wind: SW @ 13-18 knots
Comb. Seas: SW 5 - 7 ft
Barometer: Falling slowly
Aug 05, 2000
Aug 05, 2000 Near St. Paul Island
We left Dutch Harbor at dawn and are steaming north.
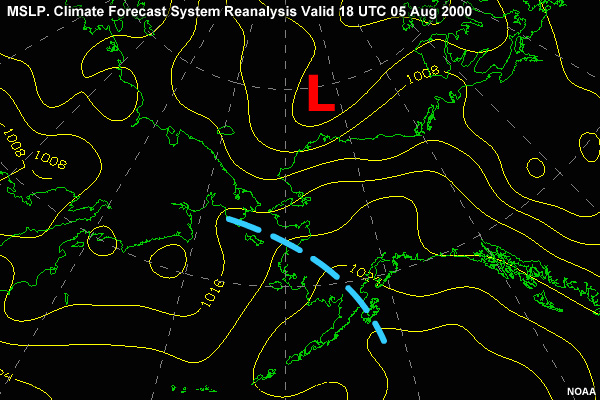
Looking at the surface chart we see the ridge of high pressure building over the eastern Bering Sea from the northern Pacific as the low moves northeast to the Barrow area.
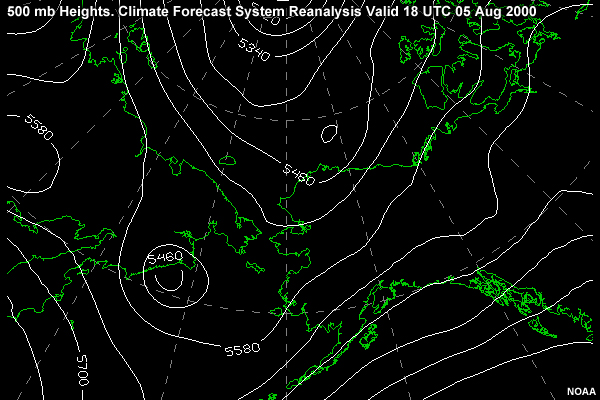
A quick check of the 500-mb chart shows the corresponding height rises, consistent with the low moving out ahead of the ridge.
Aug 05, 2000 Fog
The trip is marked by smooth sailing. Areas of dense fog persist across the Eastern Bering Sea. Nothing unusual there. Weather outside of the fog is generally VFR with unrestricted visibility. Inside the fog banks, the ceiling is obscured with no more than 100 feet of vertical visibility and horizontal visibility reduced to as low as 100 yards.
This has a big impact on the ship in several areas. The captain sets a low visibility watch that increases the number of lookouts to watch for the numerous fishing boats. If the ship is called upon for any search-and-rescue, it will have to be done without the on-board helicopter as the current conditions are below minimums.
Aug 05, 2000 » Fog Question
Question
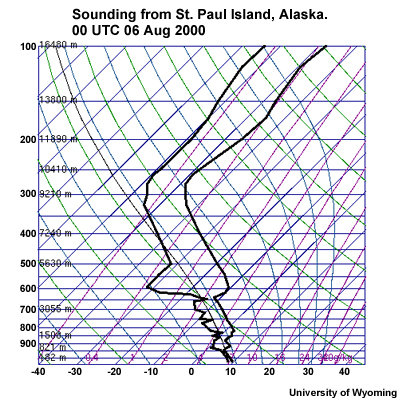
Fog, low stratus, and reduced visibility are common forecast problems throughout the Arctic. This sounding comes from nearby St. Paul Island. Which of the following features indicate fog? (Choose all that apply.)
The correct answers are a) and b).
Fog is characterized by a saturated layer near the surface where the dewpoint equals the temperature. This moist layer is kept from mixing with drier air aloft by an inversion near the fog top.
Aug 05, 2000 Vessel Icing
One good thing about being here in summer is that we don’t need to worry about superstructure icing. However, it will definitely become a problem later in the autumn.
Aug 05, 2000 » Vessel Icing Question
Question
Why is icing not a threat at this time? (Choose the best answer.)
The correct answer is b).
The air temperature is above the freezing point of seawater.
To learn more, click link below to open the lesson titled "Vessel Icing" in a new tab or window.
Aug 06, 2000
Aug 06, 2000West of Nunivak Island
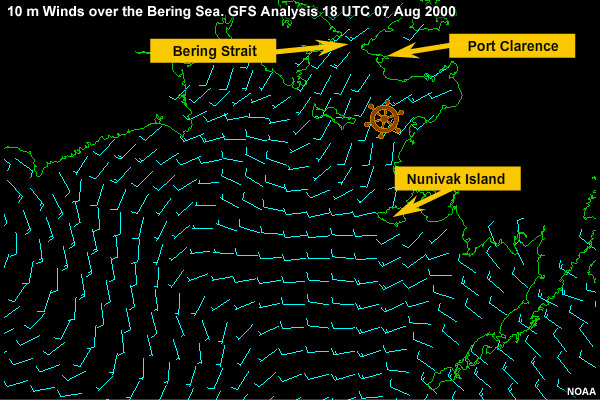
As the ship approaches the west coast of Nunivak Island, I notice the wind is on the increase at southerly 25 knots. So I update the weather for stronger wind and a bit higher sea state of 7-9 feet.
Aug 06, 2000Current Weather
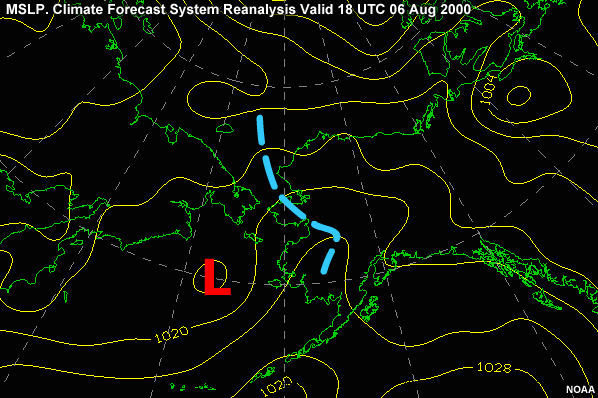
On the 6th at 1800Z, the charts show the ridge continuing to build across the ship’s track. A small cutoff low crossed the east coast of Siberia and is heading our way.
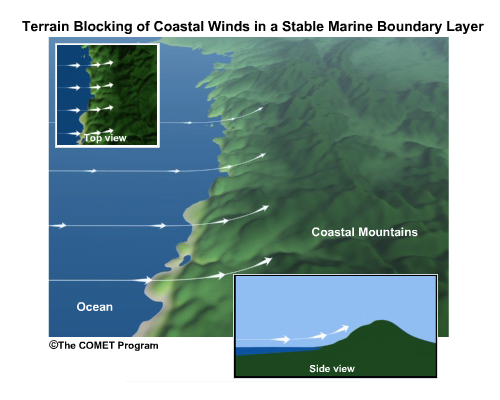
It appears that the tightening of the gradient and increase in wind speed is due to the approaching low pressing against the headland cliffs of Nunivak Island.
The model fails to pick up this mesoscale weather feature. Due to the stable boundary layer, the island blocks the wind. Unable to pass over the island, the wind turns parallel to the coast and accelerates toward low pressure. It's a classic response of coastal winds in a stable marine boundary layer.
As the ship passes north of the island, the wind will become diffluent and wind speed will decrease.
Aug 06, 2000 » Current WeatherQuestion
Question
Which of the following factors increase the likelihood that wind will be blocked by topography? (Choose all that apply.)
The correct answers are a) "greater stability" and b) "increased height of terrain."
A stable atmosphere resists vertical motions. As boundary layer stability increases, it becomes more likely that wind will be blocked by terrain. Increased terrain height and decreased wind speed also increase the chance that terrain will block the wind.
Aug 06, 2000Forecast Considerations for 07 August
The next leg of the trip takes the ship abreast Norton Sound and east of St. Lawrence Island. The Captain is deciding whether to continue on into the Bering Strait and the Chukchi Sea, pull into the lee of Saint Lawrence Island, or proceed to the excellent deep water harbor at Port Clarence. The Captain asks for another brief with options. coast.
So, I look at the weather for passage through the Bering Strait.
Funneling of wind through the strait results when there is a significant pressure gradient. I've experienced gap winds before going in and out of Puget Sound with high pressure over Eastern Washington and a Pacific storm approaching the coast.
To further compound the issue, the prevailing current is from south to north. If higher pressure builds on the north side of the Bering Strait, then swell from the north could oppose a current from the south, resulting in a higher sea state and steeper waves pounding the ship and slowing it down. This happens all the time off the Virginia Capes area of the East Coast where swell from a Nor'Easter runs southwest into the northeast-flowing Gulf Stream. It's one of the so-called North Wall Effects that sailors in Norfolk, VA complain about.
To further compound the issue, the prevailing current is from south to north. If higher pressure builds on the north side of the Bering Strait, then swell from the north could oppose a current from the south, resulting in a higher sea state and steeper waves pounding the ship and slowing it down. This happens all the time off the Virginia Capes area of the East Coast where swell from a Nor'Easter runs southwest into the northeast-flowing Gulf Stream. It's one of the so-called North Wall Effects that sailors in Norfolk, VA complain about.
Flow Interaction with Topography in the Arctic
To learn more, see COMET module
North Wall Effects on Winds and Waves
Flow Interaction with Topography in the Arctic
To learn more, see COMET module
North Wall Effects on Winds and Waves
Aug 06, 2000Short-Term Forecast
Looking at winds and seas for tomorrow, everything looks good: winds at 10 knots from the south from Nunivak up to Port Clarence, increasing to 15 knots in the Bering Strait.
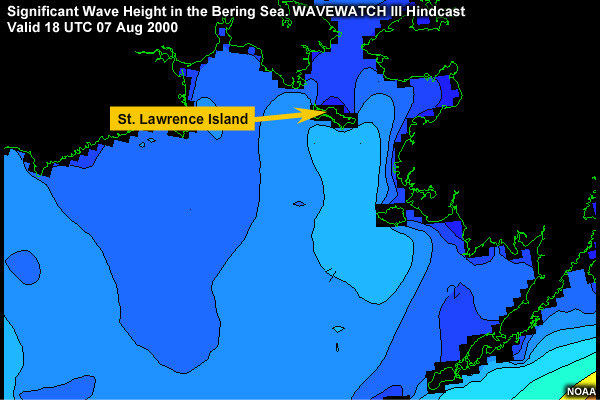
Seas are expected to be 4 feet up to Saint Lawrence Island, and then the island blocks the swell so that it's only expected to be 2 feet through the Bering Strait. With a south-southwest wind lying on top of the northward-flowing current, the sea state should be at a minimum and the ship will sail smoothly through the strait.
Aug 07, 2000
Aug 07, 2000Today's Plan
The next day, we steam across Norton Sound, bound for the Bering Strait. I prepare a forecast for our passage from Bering Strait, across the Chukchi Sea, up to Barrow.
North of the Bering Strait, there are few locations that offer a shelter for a ship in heavy seas. Our biggest threat is lows travelling west-to-east along the north shore of Russia. With a fetch that stretches from the north coast of Siberia to the western coast of Alaska, these systems can kick up large seas. If conditions look poor, we'll stop at Port Clarence and wait for the weather to pass.
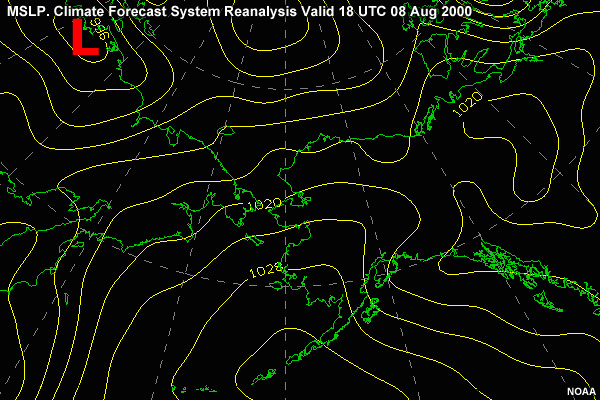
Aug 07, 2000The Forecast
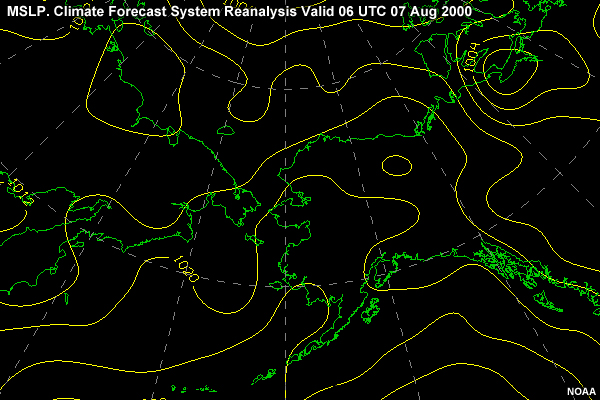
Looking at the charts, at 07/0600z Aug, I see sea level pressure dropping to the north to a low near the North Pole. There is a weak ridge from the Russian Arctic coast to the northern Bering Sea.
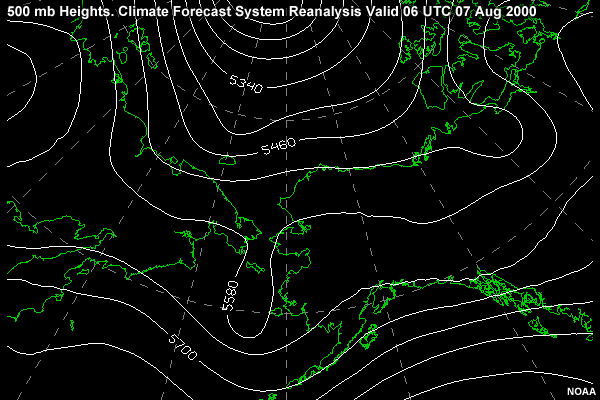
Looking at the 500-mb chart, we see one longwave trough over the western Bering Sea and another over Siberia. The ridge over the Pacific and the eastern Bering Sea continues to hold stationary and acts as a block for lows moving from the west to the east.
After I gave the captain this summary, he asked for a "window" to steam without encountering much in the way of weather or ice. Once in the Barrow area there are few sheltered locations that reduce the weather's impact on the ship. Since it appears that conditions will remain moderate, I advise the Captain that this would be a good time to move the ship north to the area off Barrow. However, there is a low even farther east that presently doesn't amount to much. Should that low track east and deepen, it could present a problem for the ship. Cyclones are not unknown in these parts and can result in high winds and seas.
Aug 07, 2000 » The ForecastQuestion
Question
The occurrence of Arctic cyclones correlates well with strong surface temperature gradients. (Choose the best answer.)
The correct answer is True.
In winter this occurs in the North Atlantic, where the North Atlantic Drift, the eastward extension of the Gulf Stream, enters the Arctic. In summer, strong surface temperature gradients occur along the Arctic coast, particularly the Eurasian coast.
Aug 07, 2000Sea Ice
In our last briefing, the captain asked for an update on the sea ice near Barrow. Ice is a constant threat to any ship transiting through the Arctic. The ship was reinforced for ice operations after assuming operations by the Coast Guard. However, if we were beset, the ship could sustain considerable damage.
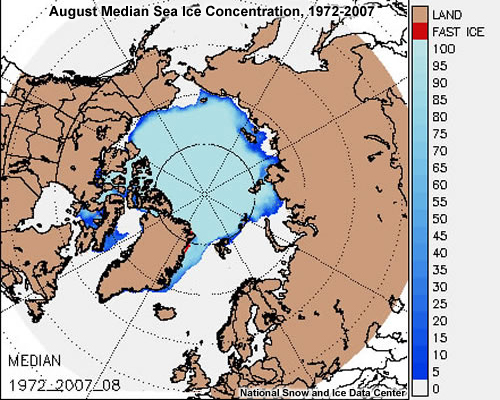
We need to know the current extent of the ice edge in the Barrow area and the approaches to it. The median ice concentration for August shows that Barrow should be clear, but close to the ice edge. In a year with above average ice, we might have trouble reaching Barrow this early.
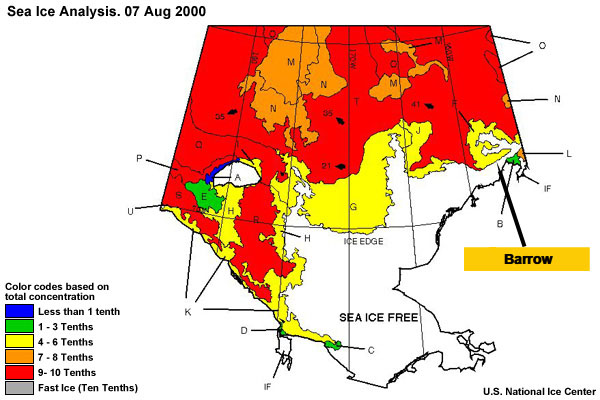
Fortunately the National Ice Center produces some very useful ice analysis and forecast products. The current analysis clearly shows the approaches have less than 10% ice; however, farther east there is still considerable ice.
The ship will keep its operations in waters where the forecast charts call for less than 3 tenths ice. Coverage of more than 3 tenths will restrict navigation and reduce speed and the response time required to stand clear of the pack ice
Aug 07, 2000 » Sea IceQuestion
Question
Are icebergs a significant concern near Barrow? (Choose the best answer.)
The correct answer is b) "No."
Icebergs are rare in the Chukchi and Beaufort Seas. They're mostly a concern for operations around or south of Greenland. Icebergs originate from glaciers, and since few glaciers reach the sea in this part of the Arctic, there are few icebergs.
To learn more, click link below to open the lesson titled "Sea Ice and Icebergs" in a new tab or window.
Aug 07, 2000Reporting Weather Observations
After looking at the sea ice analysis, I contact the Quartermaster of the Watch. We discuss taking ice observations and adding them to the outgoing synoptic observations. Since there are so few observations north of the Bering Strait, I recommend the ship shift to 3-hourly weather observations.
The Coast Guard and Pacific Fleet instructions require an observation at least every six hours. The additional observations will help weather models initialize properly and keep the Naval Maritime Forecast Centers appraised of current conditions
Aug 08, 2000
Aug 08, 2000 Bering Strait
We passed through the Bering Strait about 6 hours ago. Our next landmark will be Point Hope.
The combination of following winds, seas, and currents made for smooth passage. As we head into the Chukchi Sea, I review the oceanographic conditions we're likely to encounter. I want to know where the strong currents and large tides are. Those factors could impact operations in terms of ice drift and safe havens.
Aug 08, 2000 » Bering Strait Question
Question
Which of the following are characteristic of surface currents in the Arctic Ocean? (Choose all that apply.)
The only correct answer is b) "Generally weak (speed <0.5 kt)."
Currents tend to flow west to east along the coasts of Eurasia and North America. Surface currents tend to flow into the Arctic through the Bering Strait and Norwegian Current.
To learn more, click link below to open the lesson titled "Arctic Oceanography" in a new tab or window.
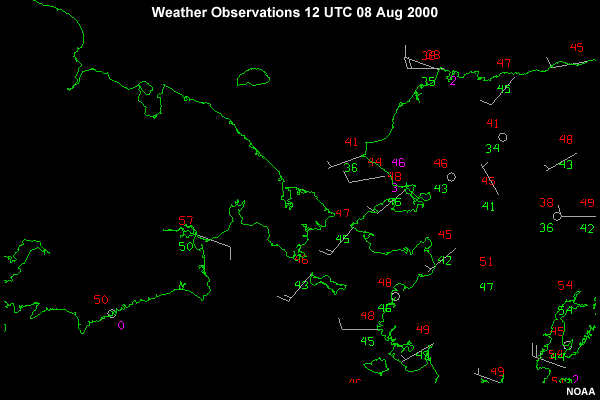
Aug 08, 2000 Weather Analysis
A weak low has formed over the Russian coast near 140E at 08/1800Z.
An upper level short wave trough follows close behind as it rotates around the 500-mb low to our north. Unfortunately, we aren't getting observations from Russian Arctic, so it's difficult to verify the model analysis. Models without sufficient data input tend to smooth out surface features.
The low has been moving across the Arctic Ocean, but models do not indicate it will move south to affect the Chukchi Sea or North Slope area of Alaska. The track of the surface low is east-northeast.
Aug 09, 2000
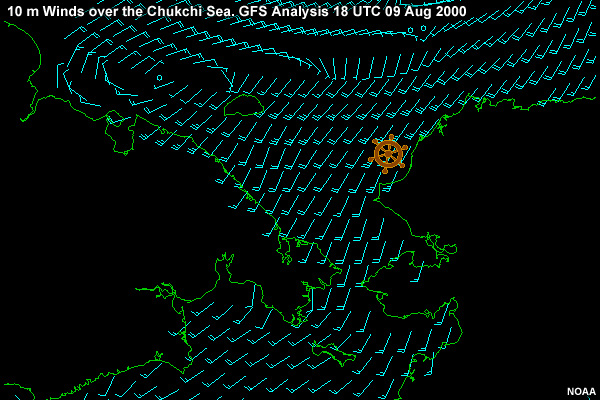
Aug 09, 2000Point Lay
On August 09 at 18Z the cutter has progressed to a location just off Point Lay.
Aug 09, 2000Morning Weather Briefing - Surface
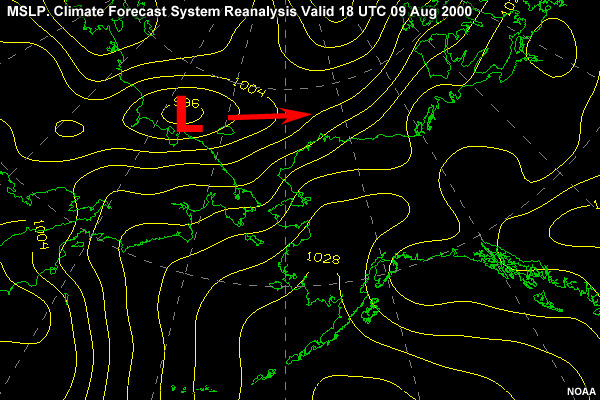
During the morning brief on August 09, the charts show a 996-mb gale low near 75N/165E. The models now call for this low to move east along 75N and weaken to 998 mb.
This will result in an easing of the wind gradient to SW 25 kt
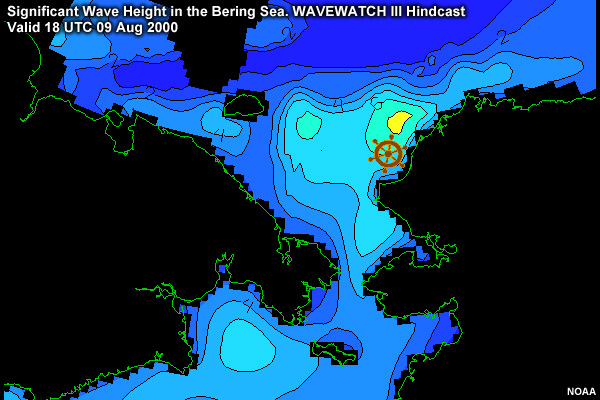
and the combined seas to SW 6-8 ft. Ice is not expected to be a factor as the wind would push any ice out of the area to the northeast and away from the coastline.
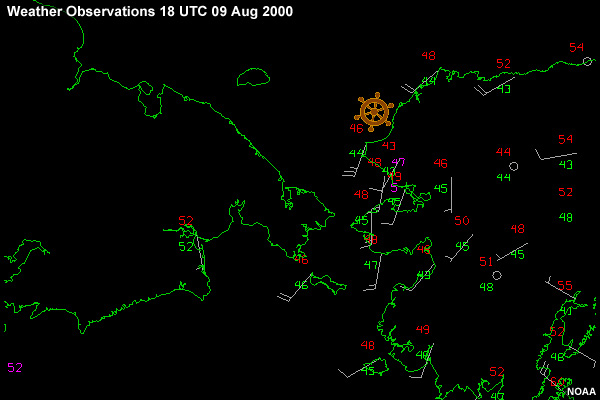
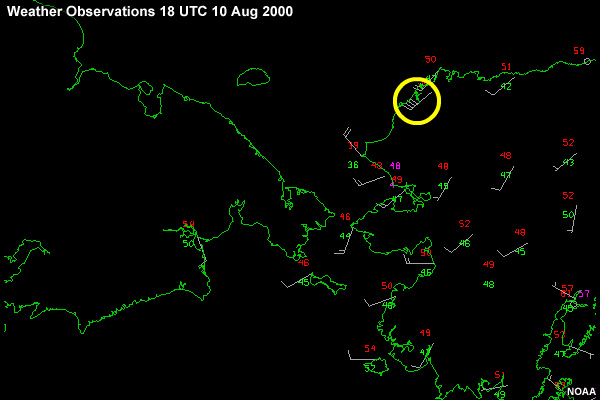
The model analysis agrees well with the only observation for this hour.
Aug 09, 2000Morning Weather Briefing - 500 mb
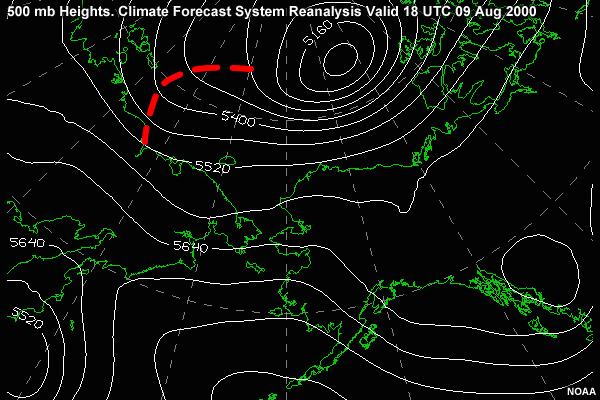
The 500-mb charts indicate a small shortwave west of the low and rotating around the southern periphery of the upper level low. We'll need to keep an eye on this. Lift from a trough aloft can deepen a surface low if it passes overhead.
Through the evening of August 09 the charts maintain the strength of the low as it passes over the dateline. The consistency of the progs gives me some confidence that the model runs have a good handle on the weather forecasts.
The captain gave night orders to awaken him if the wind rises above 30 kt. I made arrangements with the bridge crew to wake me, as well.
Aug 09, 2000Weather Update
Later that evening, as the weather began to deteriorate, the captain called me. He has to decide whether to continue north or not. So it's back to the charts.
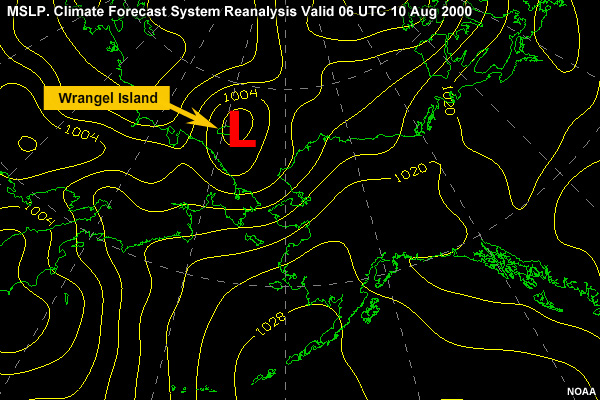
Looking at the low developing over Wrangel Island, the captain wants to know the worst case scenario.
It looks like the upper-level trough has caught up with the surface low, which is just coming off the coast. With additional lift from the trough aloft, it appears that the surface low has deepened much more than the models predicted.
If this keeps up, the storm could generate a stronger southwest wind of 35 kt, gusting to 45 kt with seas of 15-20 feet from the southwest. This places the ship at its maximum limits and it could seriously hammer the cutter.
The Captain decides to slow the advance and wait for the low to clear out of the ship's path. The cutter informs the Coast Guard district command of its intentions. The district concurs: there are no pending search-and-rescue or legal cases requiring the ship to arrive off the Port of Barrow.
Aug 10, 2000
Aug 10, 2000 Storm
0400 (1200 UTC) on the morning of August 10th, the wind veered to WSW from SW and increased to 40 knots. I met the Captain on the bridge. Clearly, I'd busted the forecast. The models missed the deepening and, in hindsight, I should have been more cautious in my forecast, especially with a low crossing in front of us.
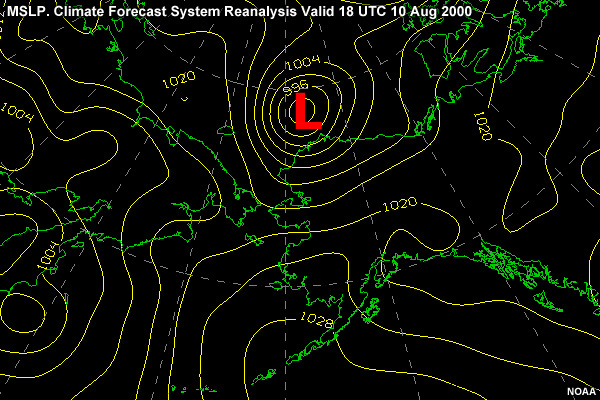
The Captain ordered the ship to head west to more open waters west of the Alaskan coast line. By mid morning, the 1200Z model run showed a much deeper surface low (992 mb)
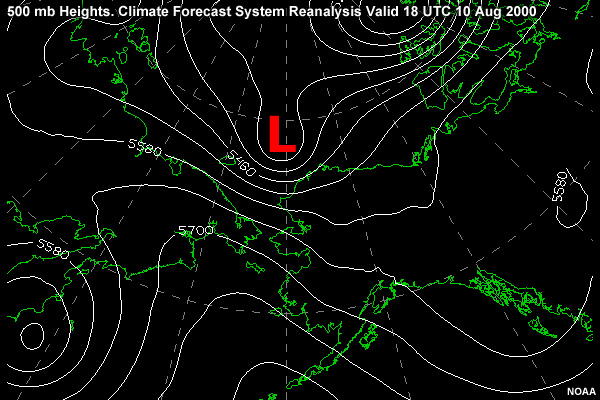
and a slightly deeper 500-mb upper level trough. The 500-mb trough was moving over the surface low.
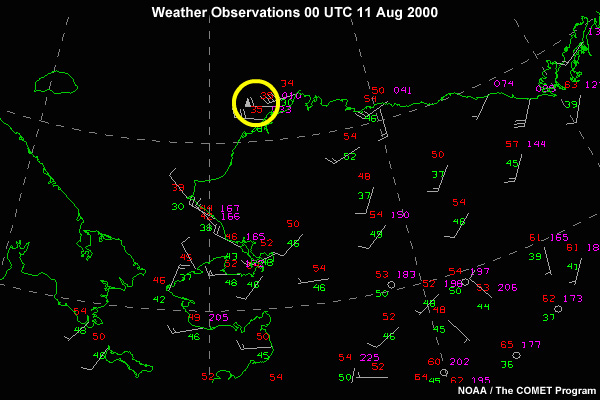
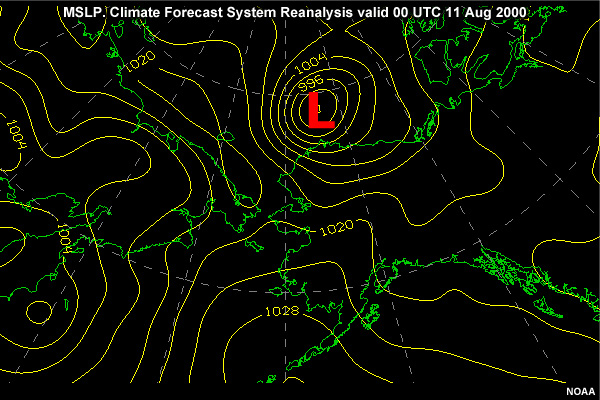
Now it's 4PM (00 UTC 11 Aug) and the wind has risen to 50 knots from the west, with gusts to 60 knots. Seas have risen to 15-18 Ft, also from the west. We now know the low pressure system is not the expected gale forecast earlier. The decision to slow was indeed fortuitous, as it kept the ship further from the center of the surface low.
I contact the Naval Maritime Forecast Center in Pearl Harbor to discuss our situation. Pearl Harbor is unaware of the events and places a coordination call with the National Ice Center for additional data.
Next the NMFC CDO contacts the NWS Office in Fairbanks. With only limited data to work from, they too, are unaware of the severity of the storm in the Chukchi Sea. They thank us for the hourly obs and update the forecast.
Aug 11, 2000
Aug 11, 2000 Analysis
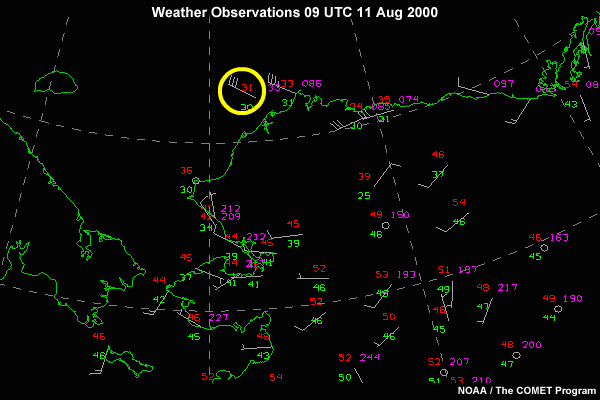
The ship rode out the storm through the night. Winds started to ease at about 9 PM (11/0300 z) to a mere 40 knots. By 1 AM (11/0900) the wind veered NW and diminished to 30 Knots. The seas stayed at the 10-12 foot mark, but as the low moved away, the wavelength lengthened, allowing for a better ride.
The cutter has resumed its transit to Barrow.
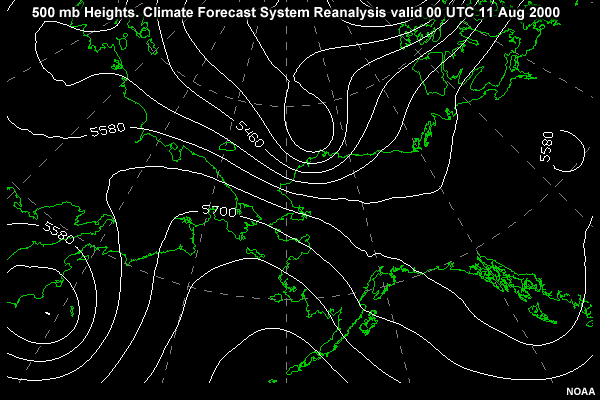
In retrospect, a very strong shortwave dropped into the backside of the upper level trough and deepened the trough.
The corresponding height falls in the upper level trough resulted in the surface low deepening to near hurricane force low. The charts did not reflect this deepening in the Arctic upper levels due to a lack of balloon data. Only limited satellite vertical sounding profiles showed any significant height falls.
Aug 12, 2000 Epilogue: Barrow
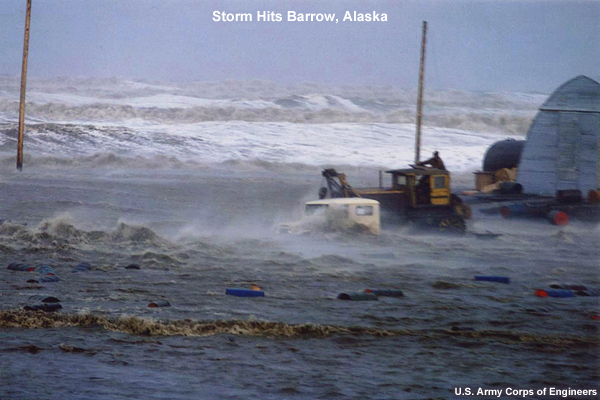
When the cutter arrives in Barrow, they find that during the storm, the borough's state-of-the-art dredge had broken free from its moorings and washed ashore, where it was pounded by surf and flooded. Damage is estimated at $7 million. Seas up to 20 feet slammed the coast, causing severe erosion. Large sections of road and sea wall were washed out, along with both of the town's boat ramps. Roofs blew off 40 buildings and many more were damaged, resulting in extensive water damage.